


 28 / 101

COMCEC Agriculture Outlook 2017
18
production of OIC member countries in the world was higher over time, reaching over 36
percent.
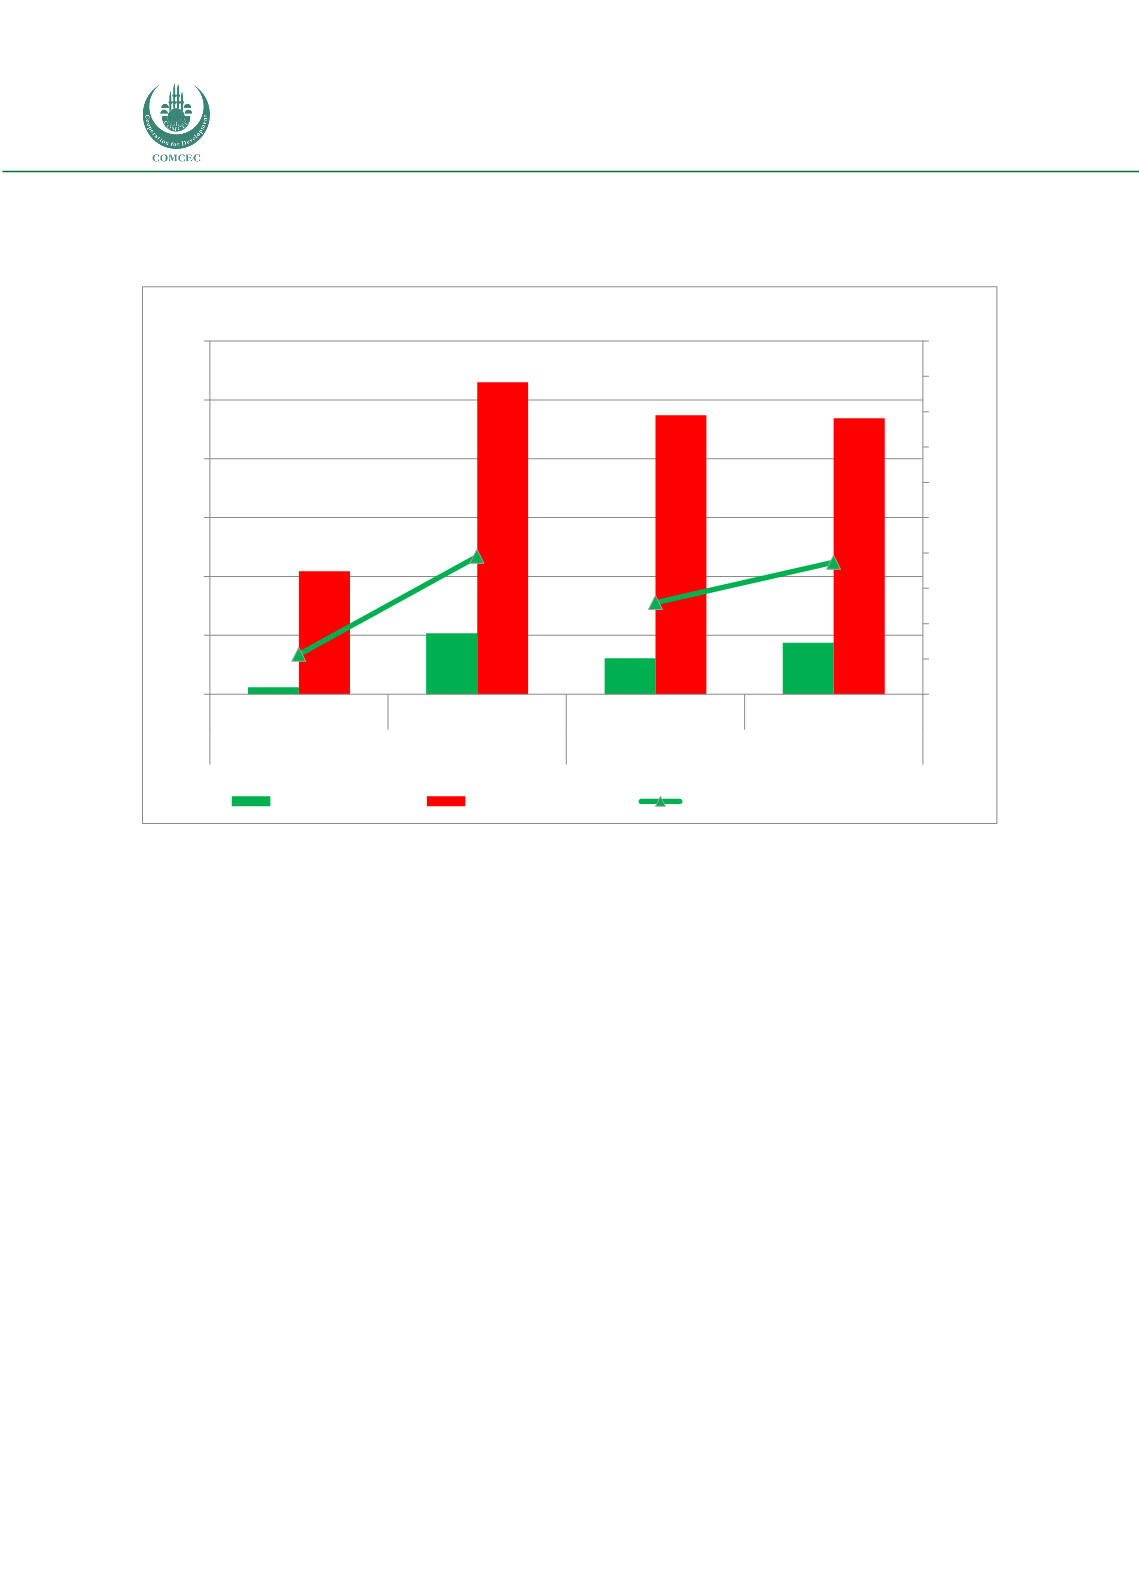
Figure 13. Fishery Productions in the OIC and Shares in the World
Source: FAOSTAT
The fisheries production undergoes a dramatic structural change in favor of capacity increase
in fish farming practices while global capture fisheries production level remains stable. The
share of non-capture fisheries production increased from a level of 30.6 percent in 2000 to
53.1 percent in 2014 while the one in OIC is increased from 16 percent in 2000 to 54.2 percent
in 2014.
2.3.
Agricultural Productivity
Agricultural productivity is a broad concept which does not lend itself to a single
measurement. In general terms, it is defined as the ratio of agricultural outputs to agricultural
inputs. There are a wide variety of productivity measures depending on the degree and type of
aggregation of outputs and inputs: single output and a single input (wheat production/wheat
area), aggregate output and single input (value of crop outputs/total crop area), single output
and aggregate inputs (wheat production/value of inputs), aggregate output and aggregate
inputs (value of crop production/ value of inputs used in crop production). Furthermore,
aggregations can be done using prices as weights but also using other indexing methodologies.
Since land and labor are the most important inputs which are used throughout the production
process, below we present two aggregate productives to denote sector input use efficiency,
2,35
20,70
12,29
17,52
41,72
106,00
94,76
93,74
5,6
19,5
13,0
18,7
0
5
10
15
20
25
30
35
40
45
50
0
20
40
60
80
100
120
2000
2014
2000
2014
Non-Capture fisheries production
Capture fisheries production
Million Tons
Percentage
OIC (Left Axis)
World (Left Axis)
OIC Share in the World (Right Axis)