


 24 / 40

COMCEC Financial Outlook 2018
16
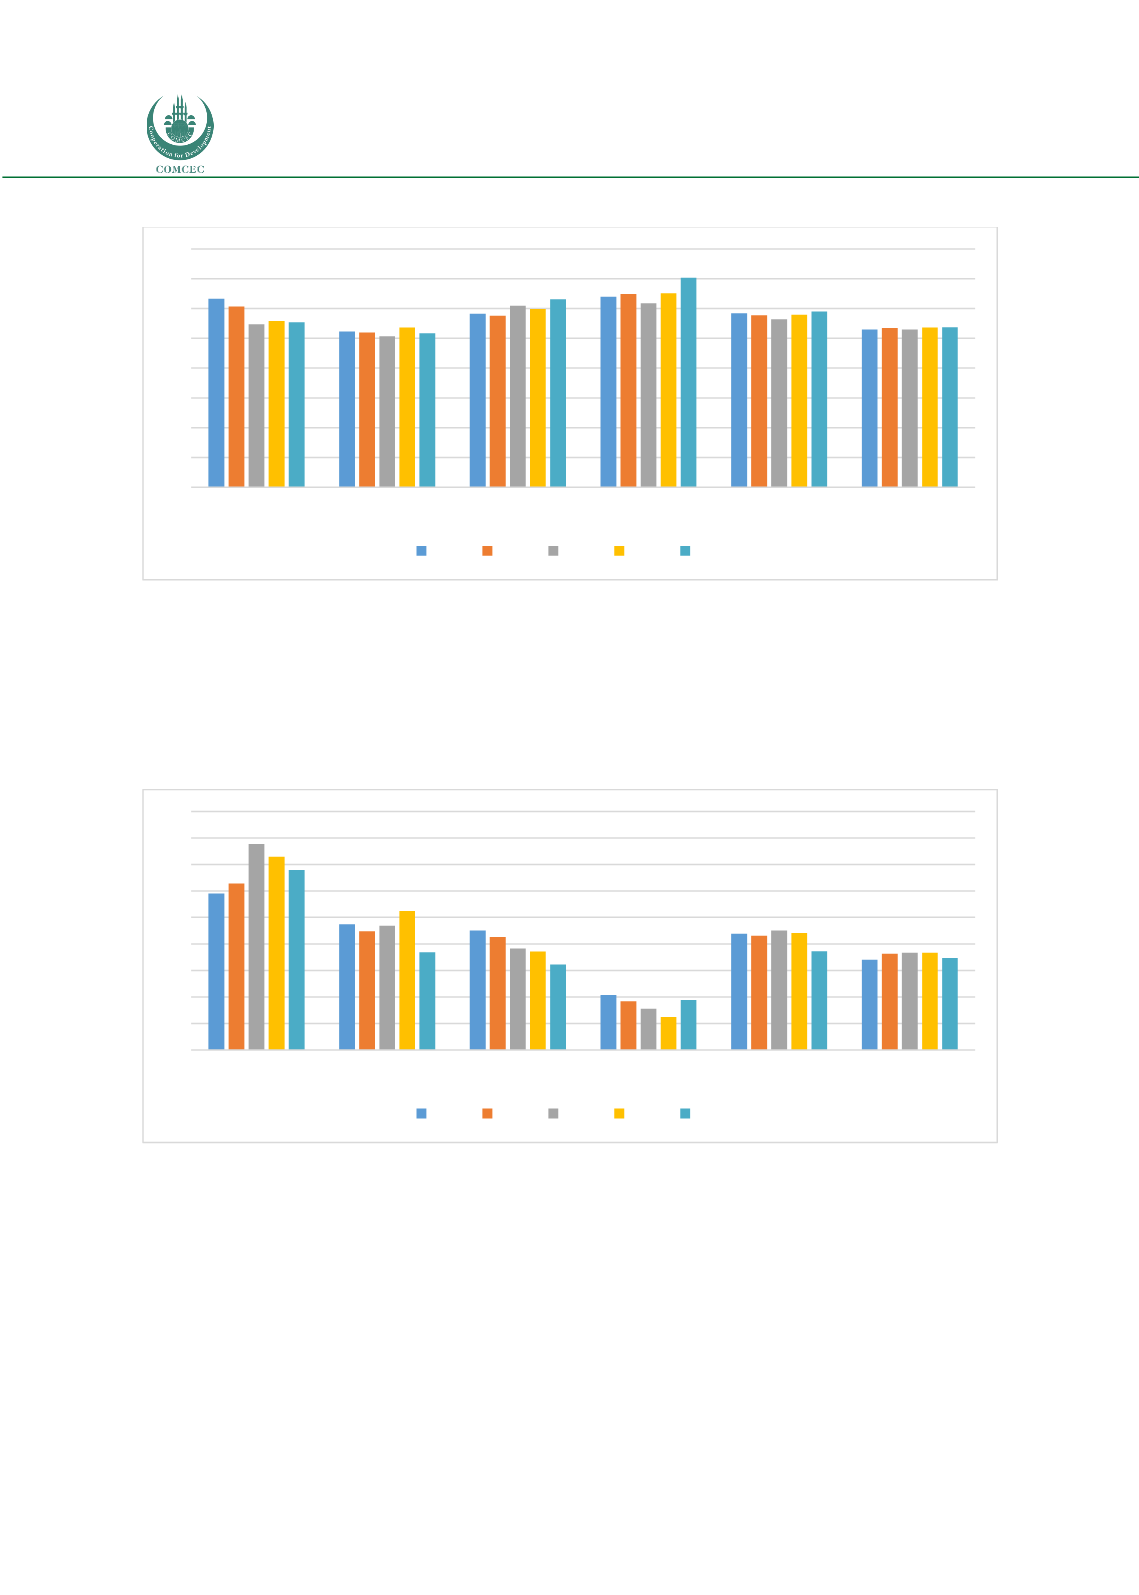
Figure 11: Bank Capital to Total Asset (%)
Source: Authors’ calculation from the World Bank Database
The bank nonperforming loans to gross loans (NPL) Ratio
is calculated as defaulting loans
(payments of interest and principal past due by 90 days or more) to total gross loans (total value
of loan portfolio). The loan amount recorded as nonperforming includes the gross value of the
loan as recorded on the balance sheet, not just the amount that is overdue. As this ratio increases,
the possibility of insolvency in the banking sector also increases.
Figure 12: Bank Non-performing Loans to Gross Loans (%)
Source: Authors’ calculation from the World Bank Database
The Figure shows that NPL ratios of OIC-LIG, OIC LMIG and OIC UMIC were higher than the OIC
HIGH. OIC-LIG score, for example, increased significantly in 2014 and as accounted for 15.5
percent. The ratio for OIC-LIG has slightly decreased to 13.6 percent in 2016 but it was still
higher than the OIC country groups and world average. The OIC-UMIG group performance
improved since 2012 and dropped to 6.4 percent in 2016. OIC-HIG has shown a very good
performance over the years and the ratio declined to 2.5 percent in 2015 and increased to 3.8 in
2016 that was much better than the world average as well.
0
2
4
6
8
10
12
14
16
OIC-LIG
OIC-LMIG
OIC-UMIG
OIC-HIG OIC-Average World Average
2012 2013 2014 2015 2016
0
2
4
6
8
10
12
14
16
18
OIC-LIG
OIC-LMIG
OIC-UMIG
OIC-HIG OIC-Average World Average
2012 2013 2014 2015 2016