


 20 / 40

COMCEC Financial Outlook 2018
12
As for intermediaries, efficiency is primarily constructed to measure the cost of intermediating
credit. Efficiency measures for institutions include indicators such as overhead costs to total
assets, net interest margin, lending-deposits spread, non-interest income to total income, and
cost to income ratio, return on assets and return on equity etc. Regarding financial markets,
efficiency measures focus less on directly measuring the cost of transactions and more on
measuring transactions. A basic measure of efficiency in the stock market is the turnover ratio.
The logic of using this variable is that the higher the turnover (the more liquidity), the more
efficient the market
15
.
In this report, the following measures for institutions and markets are used to understand and
compare the efficiency of the financial system among the countries and country groups.
Bank lending deposit spread
refers to the difference between lending rate and deposit rate.
Lending rate is the rate charged by banks on loans to the private sector and deposit interest rate
is the rate offered by commercial banks on three-month deposits.
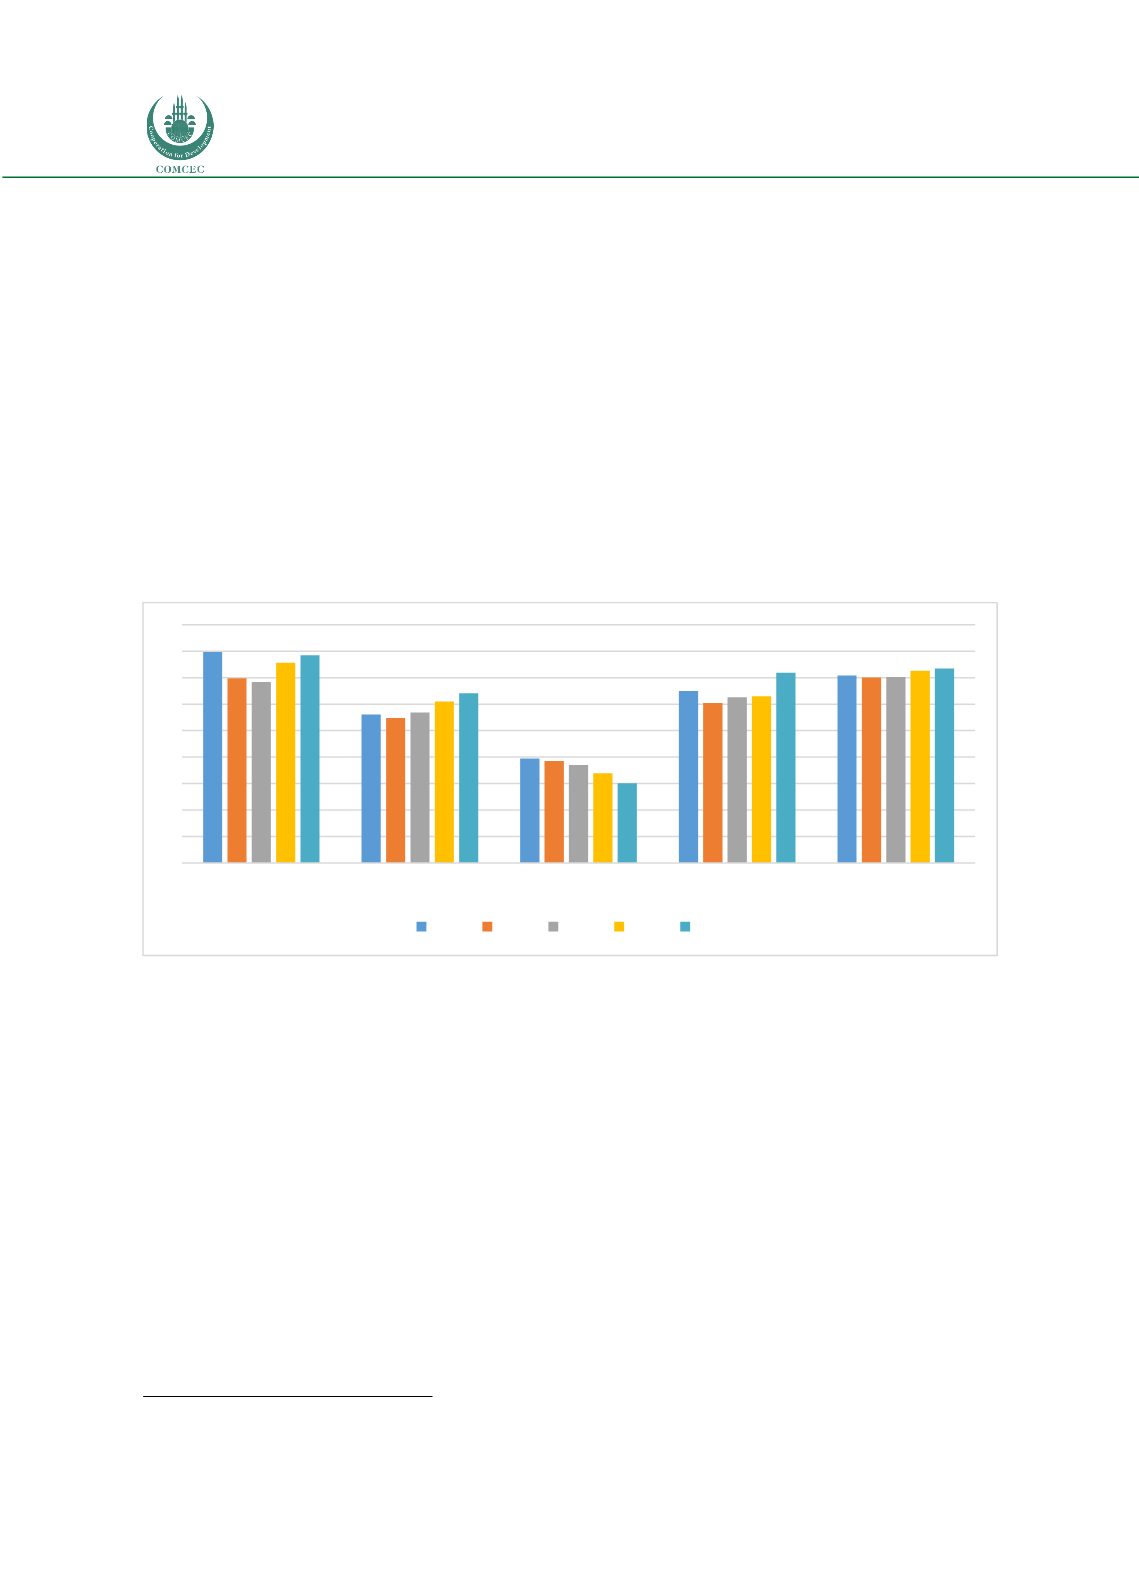
Figure 7: Bank Lending-Deposit Spread (%)
Source: Authors’ calculation from the World Bank Database
There is an indirect correlation between the level of economic development and interest rate
spreads as shown in the above Figure as the advanced and high income economies tend to have
lower spreads than the lower income groups. As the financial markets become more developed
and institutional structure of the financial system is more mature, the competition among the
intermediaries goes up leading interest rate spreads decrease. This paves the way for the better
economic environment and conducive atmosphere for investment.
The above Figure shows that OIC-LIG and OIC-LMIG lending deposit spread which was around
12.1 and 7.8 percent respectively during the selected period were relatively higher than the OIC
average rate. On the other hand, the spreads of OIC-UMIG and OIC-HIGH were quite lower than
the world average and realized as around 6.4 percent and 3 percent respectively during the
same period.
15
Cihak, M., Demirgüç-Kunt, A. “Benchmarking Financial Systems Around The World 2012, World Bank”
0
1
2
3
4
5
6
7
8
9
OIC-LMIG
OIC-UMIG
OIC-HIG
OIC-Average
World Average
2012 2013 2014 2015 2016