


 15 / 40

COMCEC Financial Outlook 2018
7
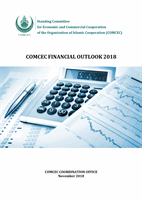
Figure 2: Deposit Money Banks' Assets to GDP (%)
Source: Authors’ calculation from the World Bank Database
In order to measure depth in the financial markets size of the stock and bond markets could be
used as an indicator. To approximate the size of the stock markets, the most common choice in
the literature is stock market capitalization to GDP
11
. This indicator refers to the total value of
all listed shares in a stock market as a percentage of GDP.
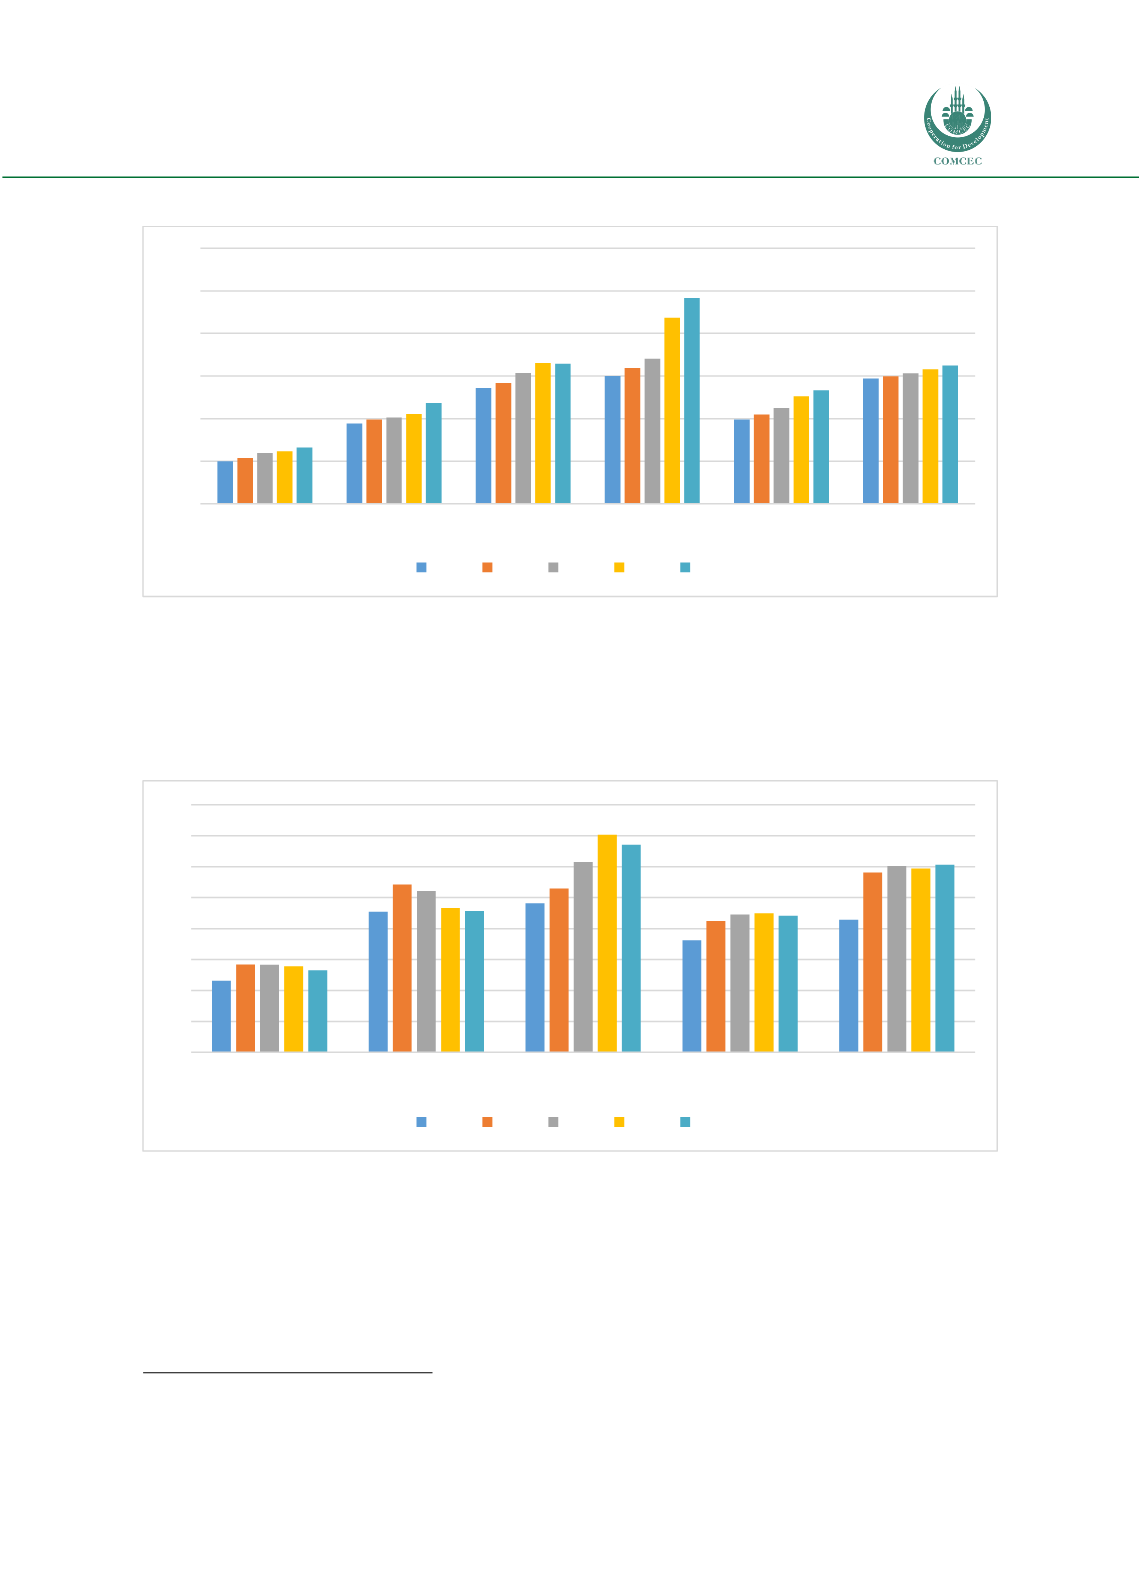
Figure 3: Stock Market Capitalization to GDP (%)
Source: Authors’ calculation from the World Bank Database
Regarding this indicator, the low income group of OIC member countries does not have data;
therefore, the analysis will be conducted on the rest of the country groups. The world average
recorded as 60.6% in 2016. The OIC average increased continuously over the period and closed
to the world averages recording as 44.2% in 2016. The rates for the high income group of OIC
countries have been more than the world averages as the stock markets in these countries have
11
Benchmarking Financial Systems Around the World 2012, World Bank
0
20
40
60
80
100
120
OIC-LIG
OIC-LMIG OIC-UMIG
OIC-HIG OIC-Average World Average
2012 2013 2014 2015 2016
0
10
20
30
40
50
60
70
80
OIC-LMIG
OIC-UMIG
OIC-HIG
OIC-Average
World Average
2012 2013 2014 2015 2016