


 14 / 40

COMCEC Financial Outlook 2018
6
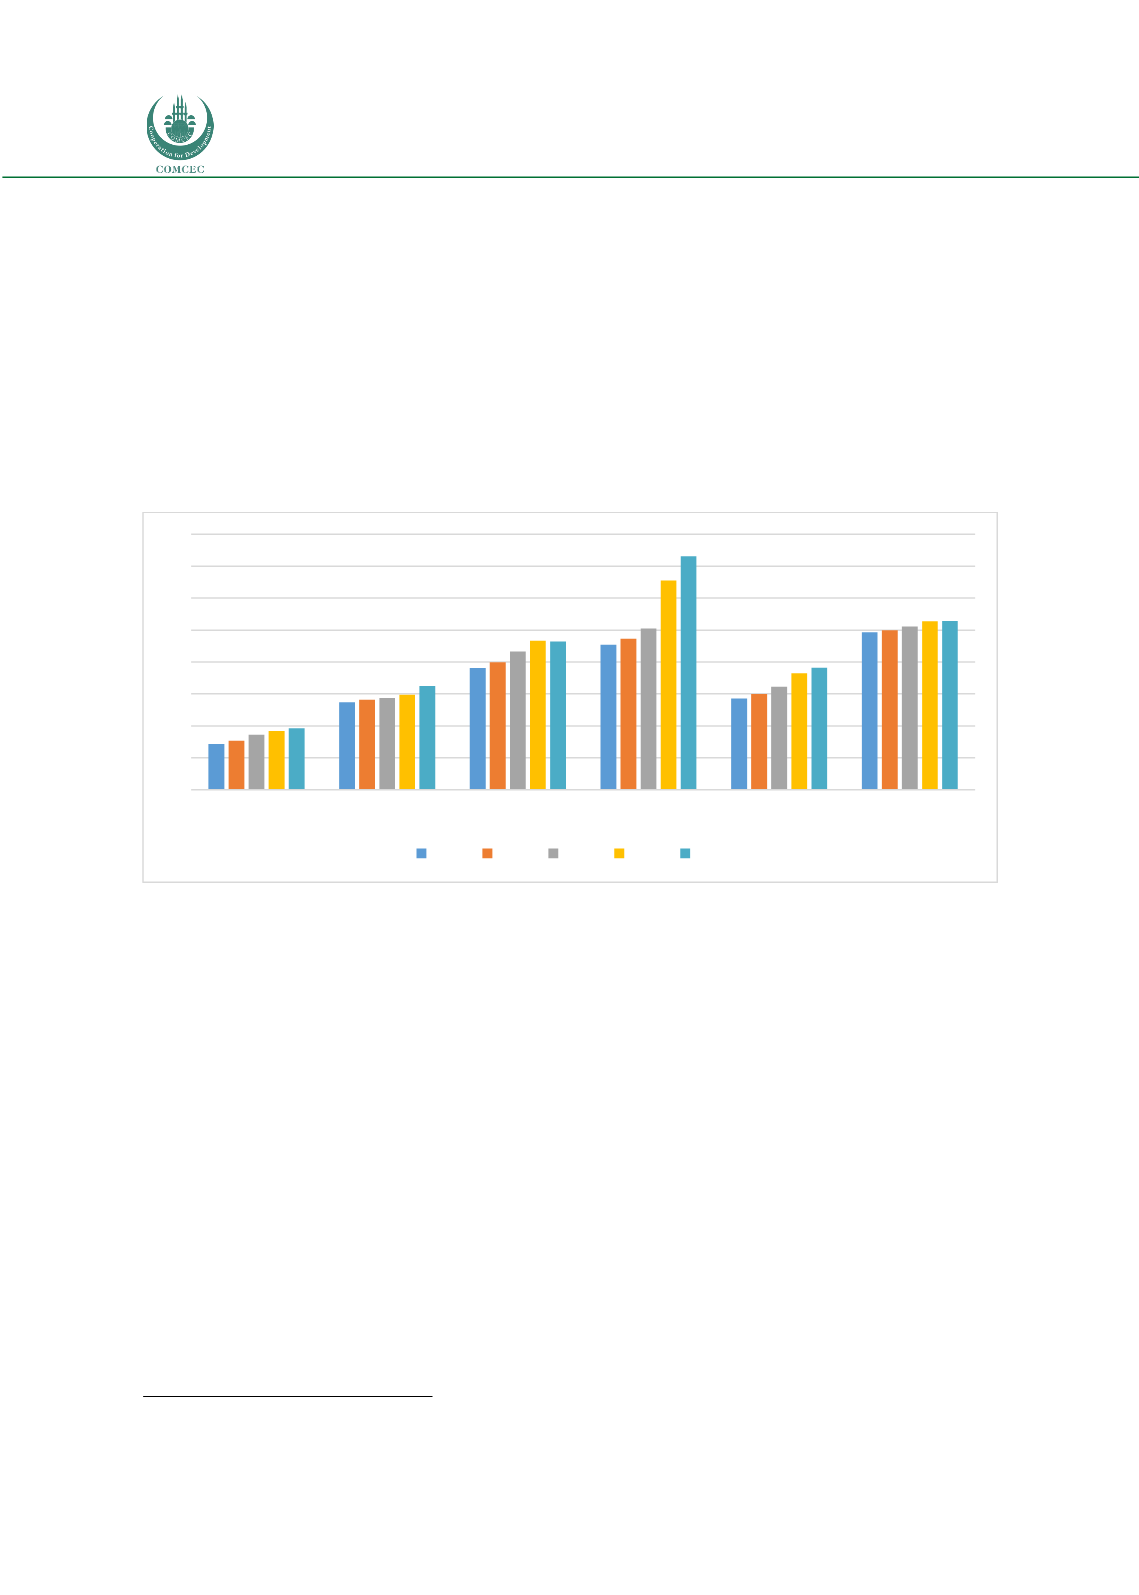
38.2%while the world average for the same period realized as 52.8%. Among the OIC countries,
the rates have been differed significantly across different income groups. As seen from the graph
below and as expected from the level of economic development, OIC-LIG and OIC-LMIG countries
have low levels of private credits from the banking sector. OIC countries have performed well
improvement over the last 5 years. Especially the rate for the OIC-HIG countries have increased
significantly over the years surpassing the world average and reached 73.2% in 2016.
As a result, it is found that there is a considerable gap between theWorld and OICMember States
average. This is a clear indication of the underdeveloped nature of the private sector and
banking in these countries and this issue can be seen as an important obstacle for investment
and economic growth of the OIC member countries.
Figure 1: Private Credit by Deposit Money Banks to GDP (%)
Source: Authors’ calculation from the World Bank Database
Another indicator used to measure the depth of the financial institutions andmarkets is
Deposit
money banks' assets as a share of GDP
. This measure refers to ‘total assets held by deposit
money banks as a share of GDP. Assets include claims on domestic real nonfinancial sector that
includes central, state and local governments, nonfinancial public enterprises and the private
sector. Deposit money banks comprise commercial banks and other financial institutions that
accept transferable deposits, such as demand deposits’
10
.
Compared to private credit, this indicator includes also credit to government and bank assets
other than credit. The results for OIC average and for various income groups are similar as the
previous indicator. As can be seen from the Figure below, OIC average increased regularly over
the years and closed to the world averages. On the other hand, the results for the OIC-UMIG and
OIC-HIG groups have surpassed the world averages in recent years. Since this indicator includes
the claims of the banks on government, the results for these two groups clearly indicates the
increasing role of the government to use financial markets more compared to the low income
groups.
10
World Bank, Global Financial Development Report, June 2018.
0
10
20
30
40
50
60
70
80
OIC-LIG
OIC-LMIG
OIC-UMIG
OIC-HIG OIC-Average World Average
2012 2013 2014 2015 2016