
Malnutrition in the OIC Member
Countries: A Trap for Poverty
COMCEC
Relationships between Poverty and Malnutrition
Multivariate Regressions
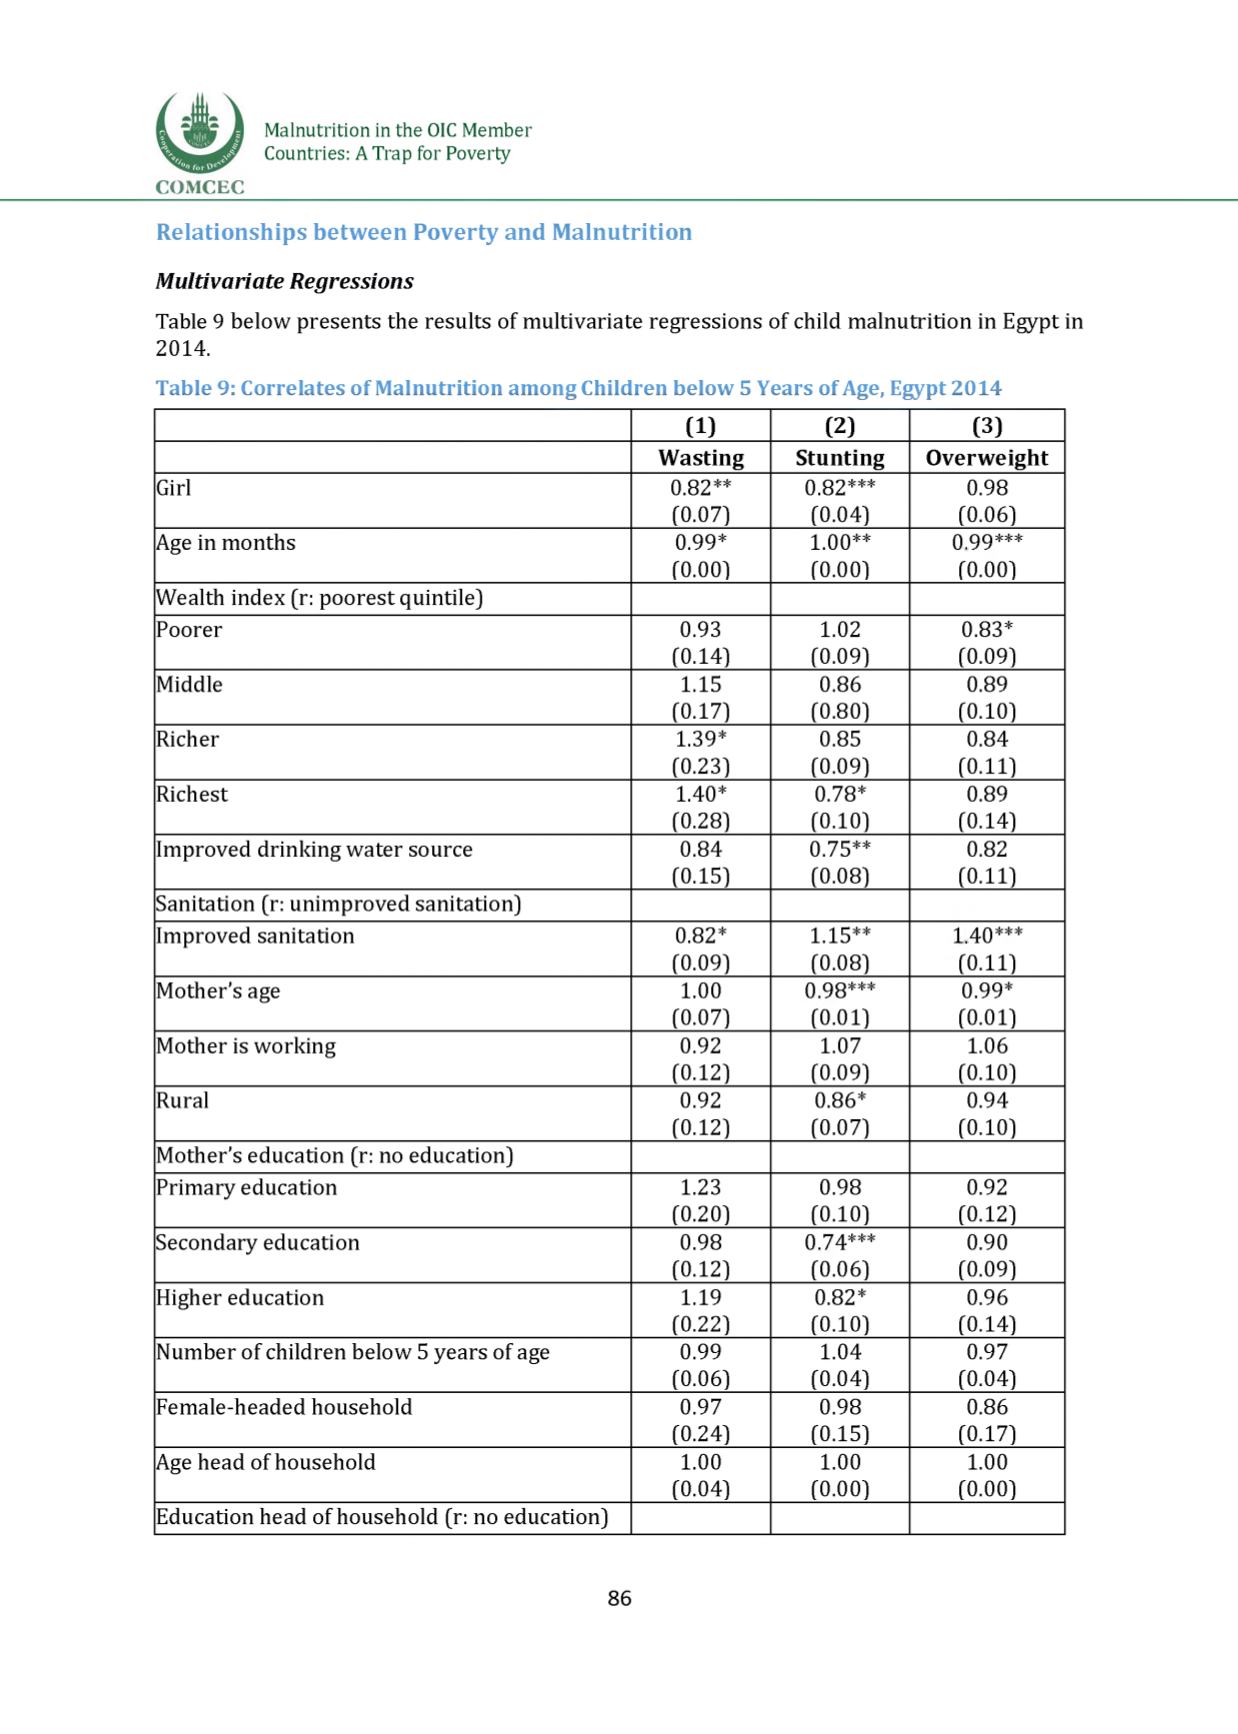
Table 9 below presents the results of multivariate regressions of child malnutrition in Egypt in
2014.
Table 9: Correlates of Malnutrition among Children below 5 Years ofAge, Egypt 2014
(
1
)
(
2
)
(3)
Wasting Stunting Overweight
Girl
0.82**
(0.07]
0.82***
(0.04]
0.98
(0.06]
Age in months
0.99*
(
0
.
0 0
]
1
.
0 0
**
(
0
.
0 0
]
0
9 9
***
(
0
.
0 0
]
Wealth index (r: poorest quintile]
Poorer
0.93
(0.14]
1. 02
(0.09]
0.83*
(0.09]
Middle
1.15
(0.17]
0 . 8 6
(0.80]
0.89
(
0
.
1 0
]
Richer
1.39*
(0.23]
0.85
(0.09]
0.84
(
0
.
1 1
]
Richest
1.40*
(0.28]
0.78*
(
0
.
1 0
]
0.89
(0.14]
Improved drinking water source
0.84
(0.15]
0.75**
(0.08]
0.82
(
0
.
1 1
]
Sanitation (r: unimproved sanitation]
Improved sanitation
0.82*
(0.09]
1.15**
(0.08]
1
4 0
***
(
0
.
1 1
]
Mother's age
1 . 00
(0.07]
0
9 8
***
(0.01]
0.99*
(
0
.
0 1
]
Mother is working
0.92
(
0
.
1 2
]
1.07
(0.09]
1.06
(
0
.
1 0
]
Rural
0.92
(
0
.
1 2
]
0
.
8 6
*
(0.07]
0.94
(
0
.
1 0
]
Mother's education (r: no education)
Primary education
1.23
(
0
.
2 0
]
0.98
(
0
.
1 0
]
0.92
(
0
.
1 2
]
Secondary education
0.98
(
0
.
1 2
]
0
7 4
***
(0.06]
0.90
(0.09]
Higher education
1.19
(
0
.
2 2
]
0.82*
(
0
.
1 0
]
0.96
(0.14]
Number of children below 5 years of age
0.99
(0.06]
1.04
(0.04]
0.97
(0.04]
Female-headed household
0.97
(0.24]
0.98
(0.15]
0 . 8 6
(0.17]
Age head of household
1 . 00
(0.04]
1 . 00
(
0
.
0 0
]
1. 00
(
0
.
0 0
]
Education head of household (r: no education]
86


