
Malnutrition in the OIC Member
Countries: A Trap for Poverty
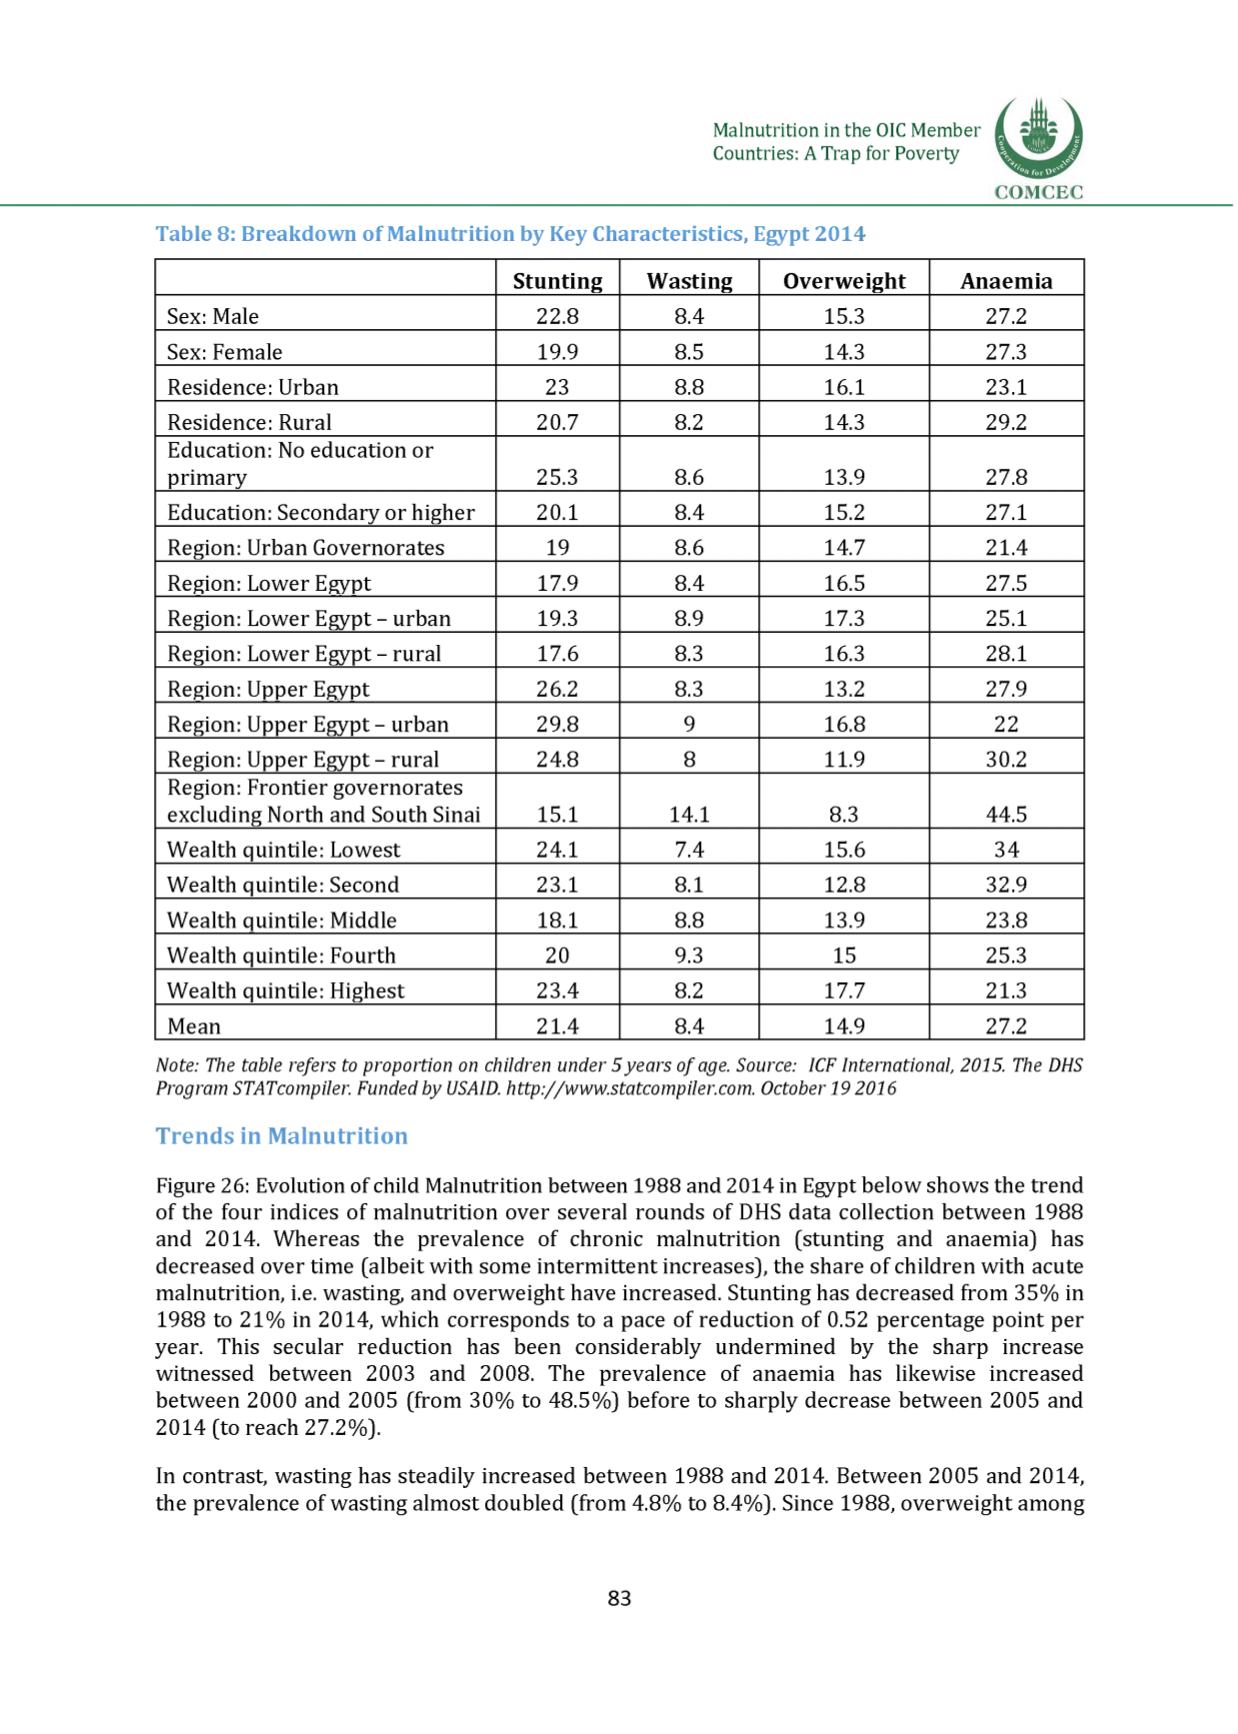
Table 8: Breakdown of Malnutrition by Key Characteristics, Egypt 2014
Stunting Wasting Overweight
Anaemia
Sex: Male
2 2 . 8
8.4
15.3
27.2
Sex: Female
19.9
8.5
14.3
27.3
Residence: Urban
23
8. 8
16.1
23.1
Residence: Rural
20.7
8.2
14.3
29.2
Education: No education or
primary
25.3
8. 6
13.9
27.8
Education: Secondary or higher
2 0 . 1
8.4
15.2
27.1
Region: Urban Governorates
19
8. 6
14.7
21.4
Region: Lower Egypt
17.9
8.4
16.5
27.5
Region: Lower Egypt - urban
19.3
8.9
17.3
25.1
Region: Lower Egypt - rural
17.6
8.3
16.3
28.1
Region: Upper Egypt
26.2
8.3
13.2
27.9
Region: Upper Egypt - urban
29.8
9
16.8
2 2
Region: Upper Egypt - rural
24.8
8
11.9
30.2
Region: Frontier governorates
excluding North and South Sinai
15.1
14.1
8.3
44.5
Wealth quintile: Lowest
24.1
7.4
15.6
34
Wealth quintile: Second
23.1
8. 1
1 2 . 8
32.9
Wealth quintile: Middle
18.1
8. 8
13.9
23.8
Wealth quintile: Fourth
2 0
9.3
15
25.3
Wealth quintile: Highest
23.4
8.2
17.7
21.3
Mean
21.4
8.4
14.9
27.2
Note: The table refers to proportion on children under 5 years of age. Source: ICF International, 2015. The DHS
Program STATcompiler. Funded by USAID.
http://www.statcompiler.com. October 19 2016
Trends in Malnutrition
Figure 26: Evolution of child Malnutrition between 1988 and 2014 in Egyptbelow shows the trend
of the four indices of malnutrition over several rounds of DHS data collection between 1988
and 2014. Whereas the prevalence of chronic malnutrition (stunting and anaemia] has
decreased over time (albeit with some intermittent increases], the share of children with acute
malnutrition, i.e. wasting, and overweight have increased. Stunting has decreased from 35% in
1988 to 21% in 2014, which corresponds to a pace of reduction of 0.52 percentage point per
year. This secular reduction has been considerably undermined by the sharp increase
witnessed between 2003 and 2008. The prevalence of anaemia has likewise increased
between 2000 and 2005 (from 30% to 48.5%] before to sharply decrease between 2005 and
2014 (to reach 27.2%].
In contrast, wasting has steadily increased between 1988 and 2014. Between 2005 and 2014,
the prevalence of wasting almost doubled (from 4.8% to 8.4%]. Since 1988, overweight among
83


