
Malnutrition in the OIC Member
Countries: A Trap for Poverty
COMCEC
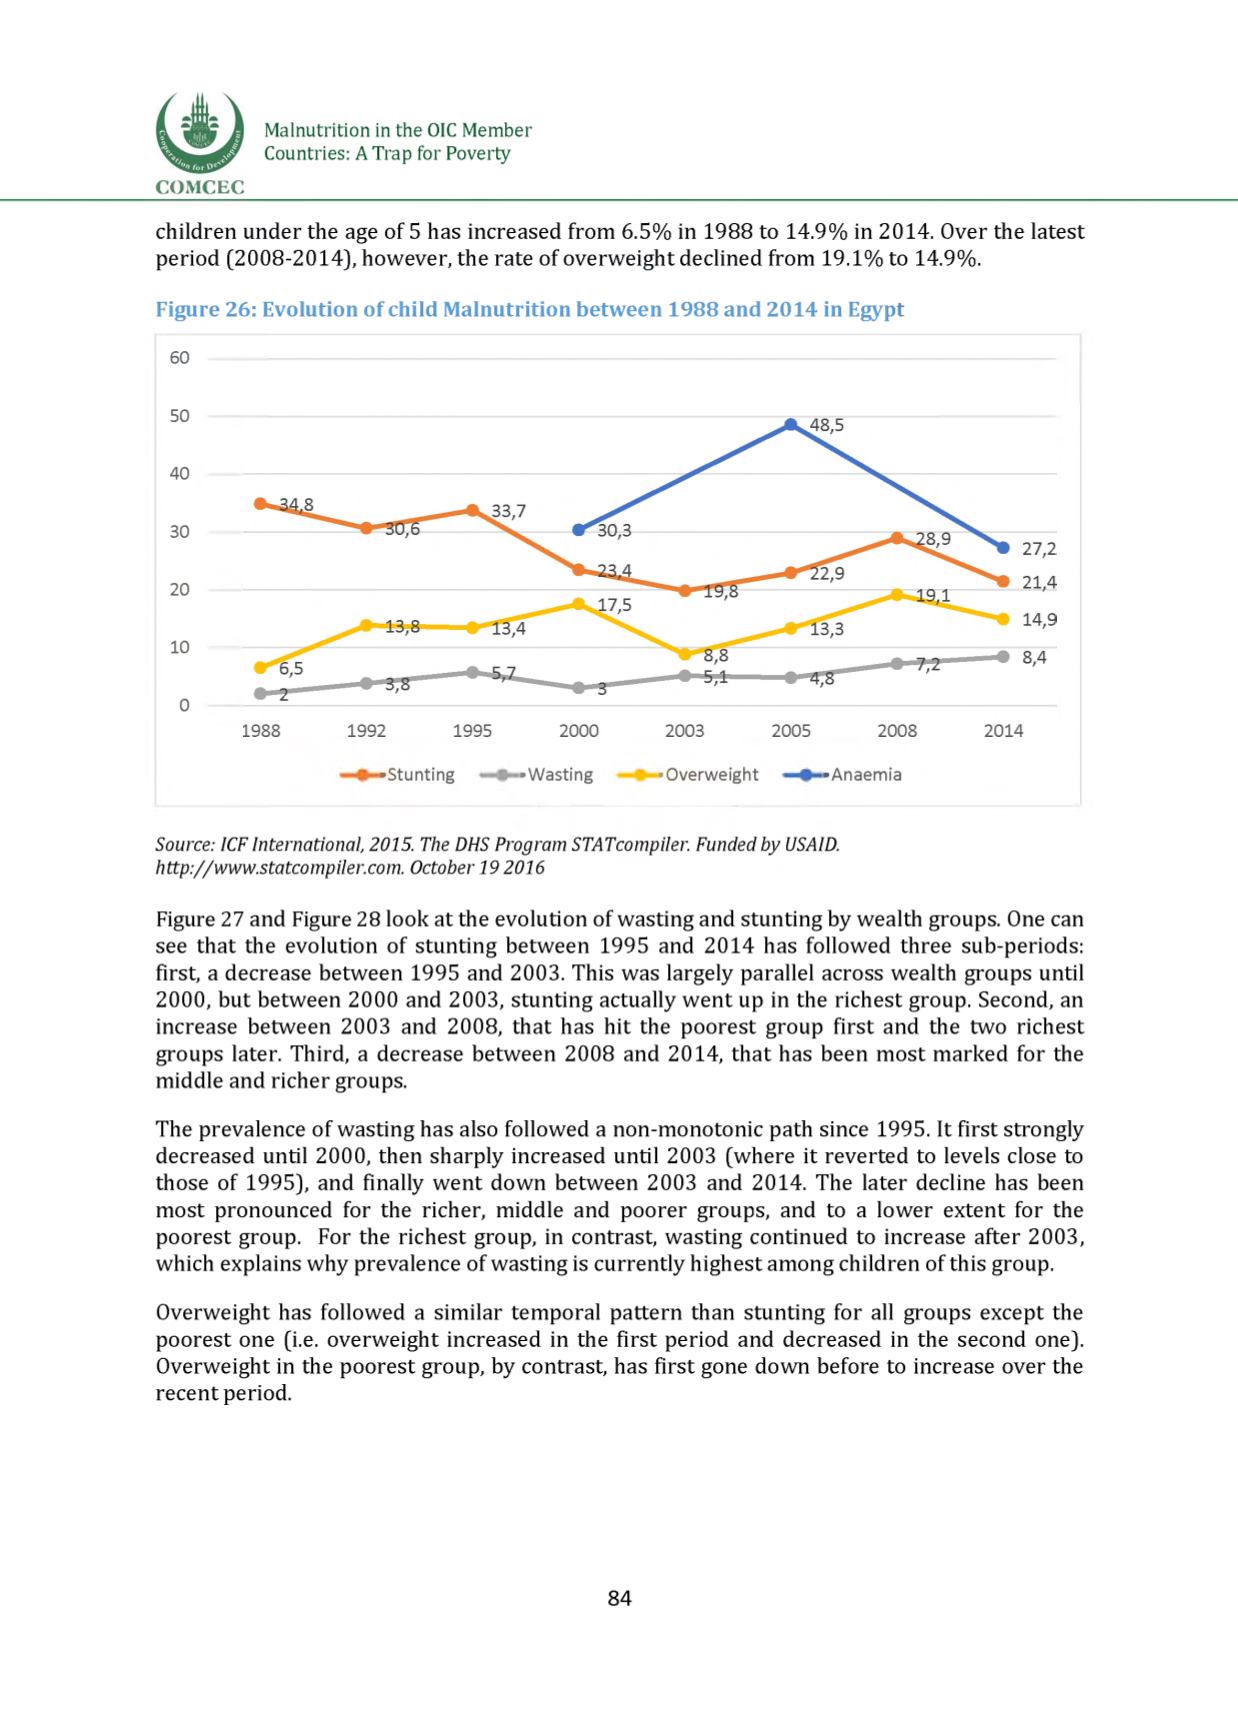
children under the age of 5 has increased from 6.5% in 1988 to 14.9% in 2014. Over the latest
period (2008-2014), however, the rate of overweight declined from 19.1% to 14.9%.
Figure 26: Evolution of child Malnutrition between 1988 and 2014 in Egypt
60
50
40
30
20
10
0
■Stunting
■Wasting
■Overweight
•Anaemia
Source: ICF International, 2015. The DHS Program STATcompiler. Funded by USAID.
http://www.statcompiler.com.October 19 2016
Figure 27an
d Figure 28look at the evolution of wasting and stunting by wealth groups. One can
see that the evolution of stunting between 1995 and 2014 has followed three sub-periods:
first, a decrease between 1995 and 2003. This was largely parallel across wealth groups until
2000, but between 2000 and 2003, stunting actually went up in the richest group. Second, an
increase between 2003 and 2008, that has hit the poorest group first and the two richest
groups later. Third, a decrease between 2008 and 2014, that has been most marked for the
middle and richer groups.
The prevalence of wasting has also followed a non-monotonic path since 1995. It first strongly
decreased until 2000, then sharply increased until 2003 (where it reverted to levels close to
those of 1995), and finally went down between 2003 and 2014. The later decline has been
most pronounced for the richer, middle and poorer groups, and to a lower extent for the
poorest group. For the richest group, in contrast, wasting continued to increase after 2003,
which explains why prevalence of wasting is currently highest among children of this group.
Overweight has followed a similar temporal pattern than stunting for all groups except the
poorest one (i.e. overweight increased in the first period and decreased in the second one).
Overweight in the poorest group, by contrast, has first gone down before to increase over the
recent period.
84


