


 146 / 253

134
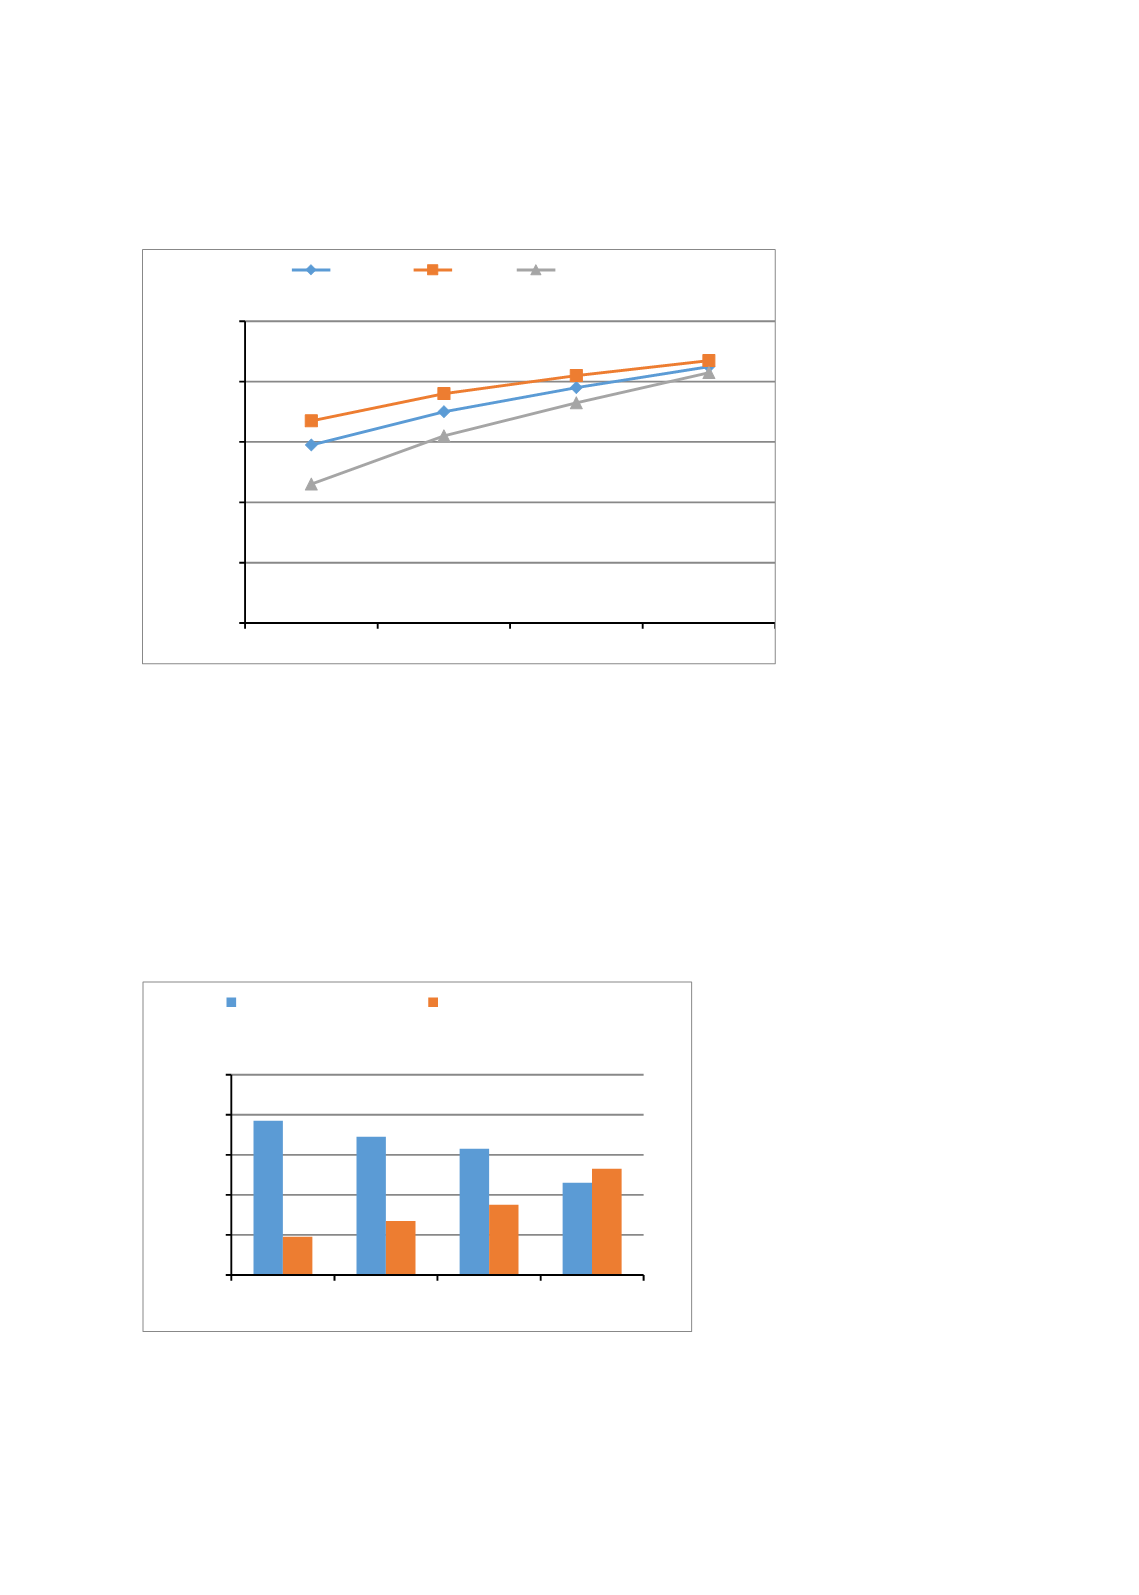
Figure 3.3.4: Enrolment by Gender and Socio-Economic Status
Source: ASER data National-Rural (2016)
The analysis for ASER 2016 data further reveals that the poorest quartile have the highest level
of children enrolled in government schools (77%) whereas the remaining 19% of the children
are enrolled in private schools (Figure 3.3.5). On the other hand, the richest quartile has the
highest number of children enrolled in private schools (53%) and the lowest percentage of
children in government schools (46%). It is evident from the figures that enrolment in
government schools falls and that for private schools increases as we move along the wealth
index towards the richest. A household’s socio-economic status, therefore, appears to be
associated with the type of school their child attends.
Figure 3.3.5: Enrolment by School Type and Socio-Economic Status
Source: ASER data National-Rural (2016)
59
70
78
85
67
76
82
87
46
62
73
83
0
20
40
60
80
100
Poorest
Poorer
Richer
Richest
% Children
Enrollment by Gender
Overall
Male
Female
77
69
63
46
19
27
35
53
0
20
40
60
80
100
Poorest
Poorer
Richer
Richest
% Children
Enrollment by Type of School
Government Schools
Private Schools