


 144 / 253

132
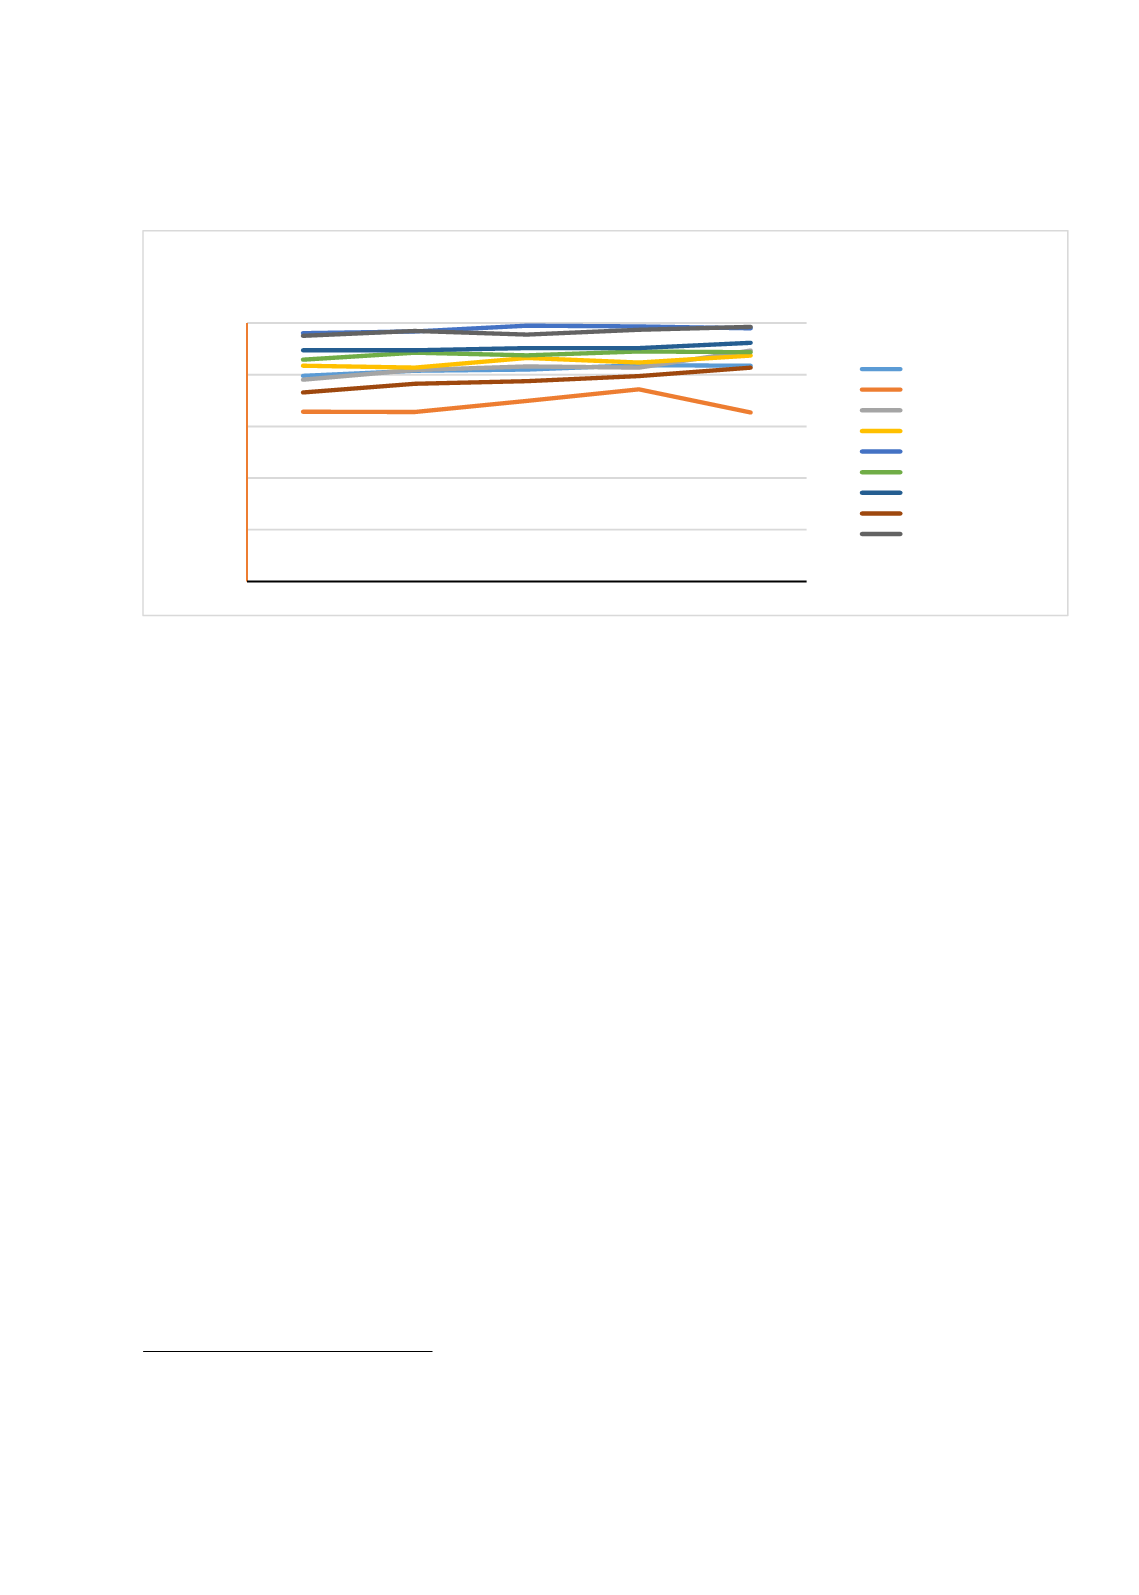
Figure 3.3.2: Enrolment by Province/Region, 2012-2016 (Children Aged 6-10 Years)
Source: ASER Rural Data (2012-2016)
As discussed in Section 2, non-state schooling is on the rise across the country. The increasingly
large proportion of children (aged 6-16) who are absorbed into ‘private’ schools is reflected in
Appendix Table A5. Latest ASER data (2016) indicates that nationally, about 23.5% of all
children aged 6-16 are enrolled in some form of ‘private’ school and this proportion has
increased from 21.7% in 2015. There remain large disparities within provinces (and regions)
with the largest enrolment in the private sector within AJK and ICT and the lowest in
Balochistan. This declining trend in enrolment within the government sector is pictorially
depicted in Figure 3.3.3 which illustrates household tending to move their children (aged 6-10
years) out of the government and into the non-state sector between 2012 and 2016.
The persistence of gender gaps in educational outcomes has been repeatedly highlighted by
ASER data over the last few years. A comparison of ASER enrolment data for 6-16 year olds
across government and private schools indicates some improvements in girls’ enrolments over
the 3 year period (Appendix Table A6). For example, girls’ enrolment in government schools
appear to have improved at the national level from 35% in 2014 to 38% in 2016 and from 37%
to about 40% over the same period in private schools. This 3% increase is not a small feat when
focusing on absolute numbers – 4,877 more girls in school in 2016 in both government and
private schools (69,295) than there were in 2014 (64,418). This national picture, whilst masking
some differences across the provinces and regions, overall depicts a pattern of small
improvements in enrolment across the board with some differences across the government and
private sectors.
ASER data can also be used to identify whether educational access and outcomes differ for
various groups on the basis of their socio-economic status. As already mentioned in Section 3,
a key feature of the data is that it collects household-level information on various indicators
which can then be effectively used to compute a wealth index. 37 These indicators measure the
37
Household indicators used: Type of house (
Type of house is a categorical variable with kutcha given the value
1, semi-pucca equals 2, and pucca equals 3)
, house owned (
Dummy equaling 1 if the house is owned, 0
otherwise)
, electricity connection (
Dummy equaling 1 if the house had electricity, visible wires and fittings, 0
0,
20,
40,
60,
80,
100,
2012
2013
2014
2015
2016
Enrolment Trends (6-10)
National Rural
Balochistan
FATA
GB
ISB
KP
Punjab
Sindh
AJK