


 145 / 253

133
economic potential and achieved levels of income and wealth of a household. ASER wealth index
have been developed by using principle component factor analysis procedure in the STATA
software38. Using this methodology, ASER 2016 national data (144 rural districts of Pakistan)
has been divided into 4 categories/quartiles (i.e. poorest, poorer, richer, and richest) thereby
representing the entire population of Pakistan in a socio-economic context.
The results depicted using the ASER Wealth Index (2012, 2013, 2014, 2015) reveal that the
richest quartile have the highest percentage of children enrolled in school (85%) whereas the
poorest quartile have the lowest enrollment rate (59%). A strong correlation between wealth
and enrollment is established as we move along the wealth index. Moreover, socio-economic
background is also found to be influencing gender inequity. Male and female children belonging
to the poorest quartile are particularly disadvantaged as depicted by the lowest enrollment
rates. The highest enrollment of males and females is again in the richest quartile (87%and 83%
respectively). Females are double disadvantaged – not only are their enrolment rates lower than
those of males but poorer females are worse off than richer ones (Figure 3.3.4).
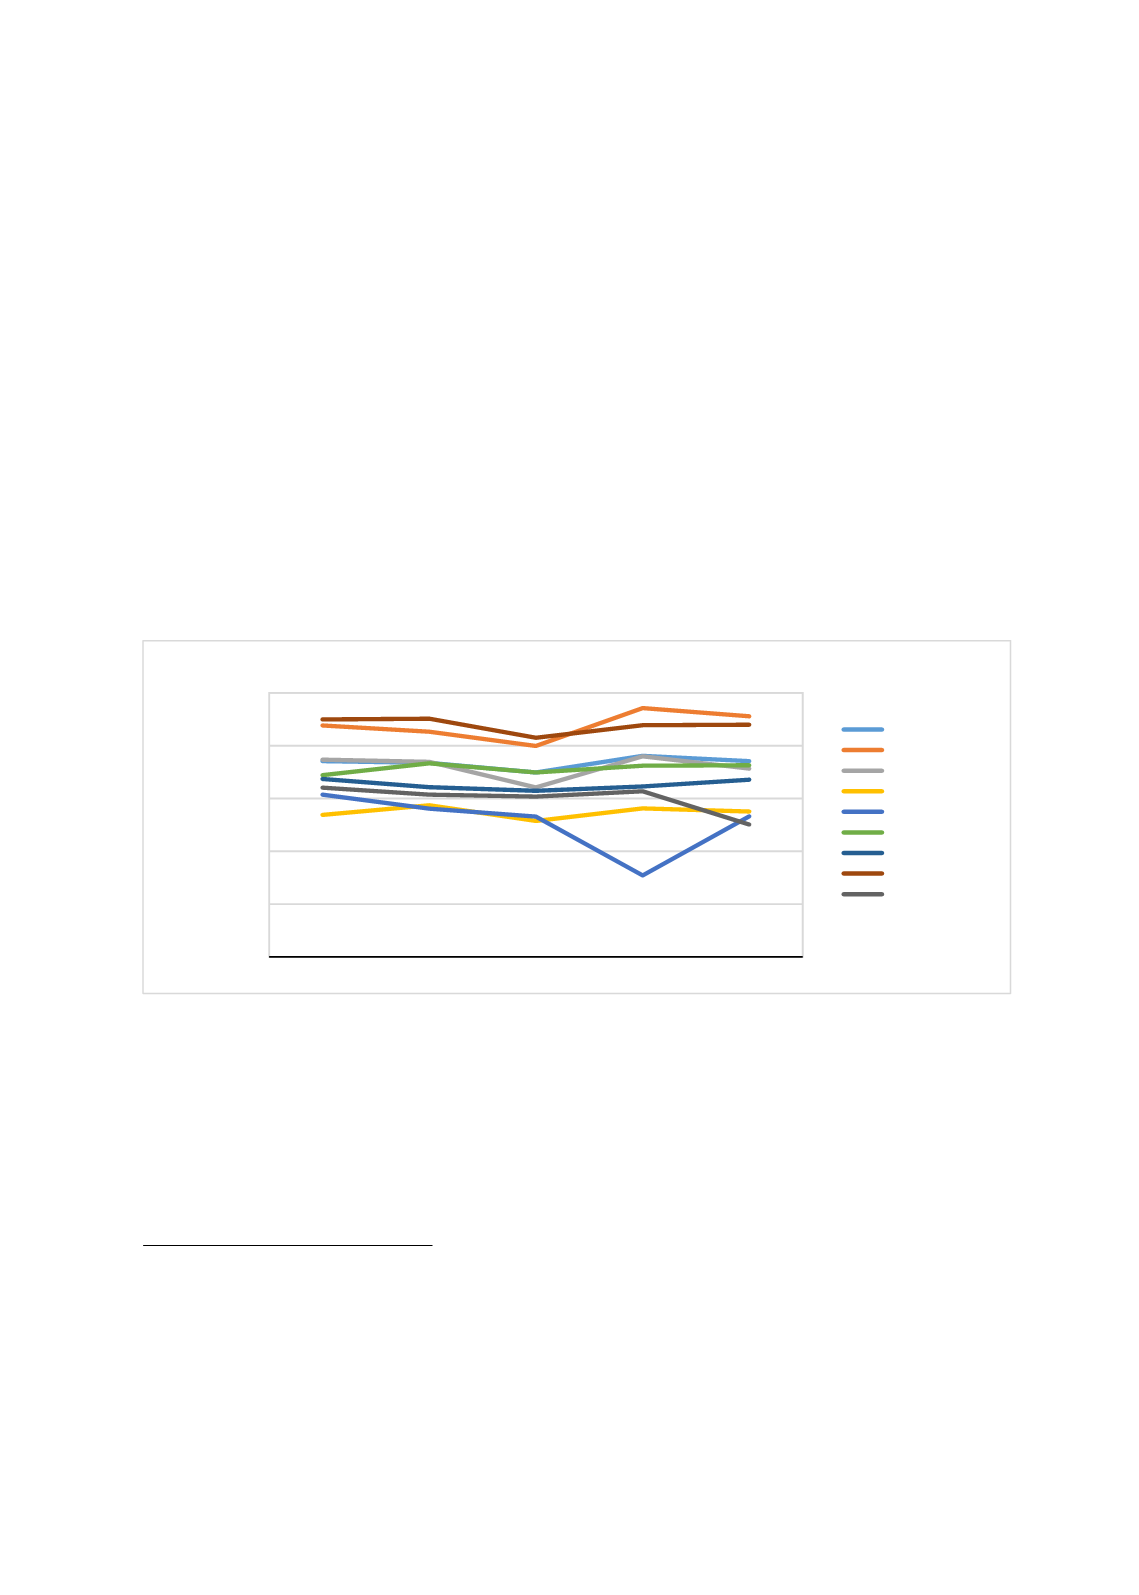
Figure 3.3.3: Enrolment in Government Schools by Province/Region, 2012-2016 (Children
Aged 6-16 Years
Source: ASER Rural Data (2012-2016)
otherwise)
, mobile (
Dummy equaling 1 if anyone in the house has a mobile, 0 otherwise)
and television (
Dummy
equaling 1 if the household has a television, 0 otherwise)
38
It factorizes variablesby creating a weighted combination of the input variables in the following manner e.g.
F
1
= a
11
X
1
+ a
12
X
2
+ ….
In order to select factors, eigen values from a principal component analysis are used and the factor coefficient
scores are created. Further, the indicator values are multiplied by the coefficient scores and added to come up
with the wealth index. The index is then divided into groups/quartiles to categorize the population according to
their wealth status.
0,
20,
40,
60,
80,
100,
2012
2013
2014
2015
2016
Government School Enrolment (6-16)
National
Balochistan
FATA
GB
ISB
KPK
Punjab
Sindh
AJK