
Education of Disadvantaged Children in OIC:
The Key to Escape from Poverty
70
rates has gotten worst over time. For example, the difference in attendance percentage points
between rural and urban has increased to 30.5 (2015) from 26.9 percentage points (2005) in
attendance of 6-11 year olds. Other indicators have experienced this increase in urban-rural
inequality except for completion rates of 5 years of schooling (stagnant inequality).
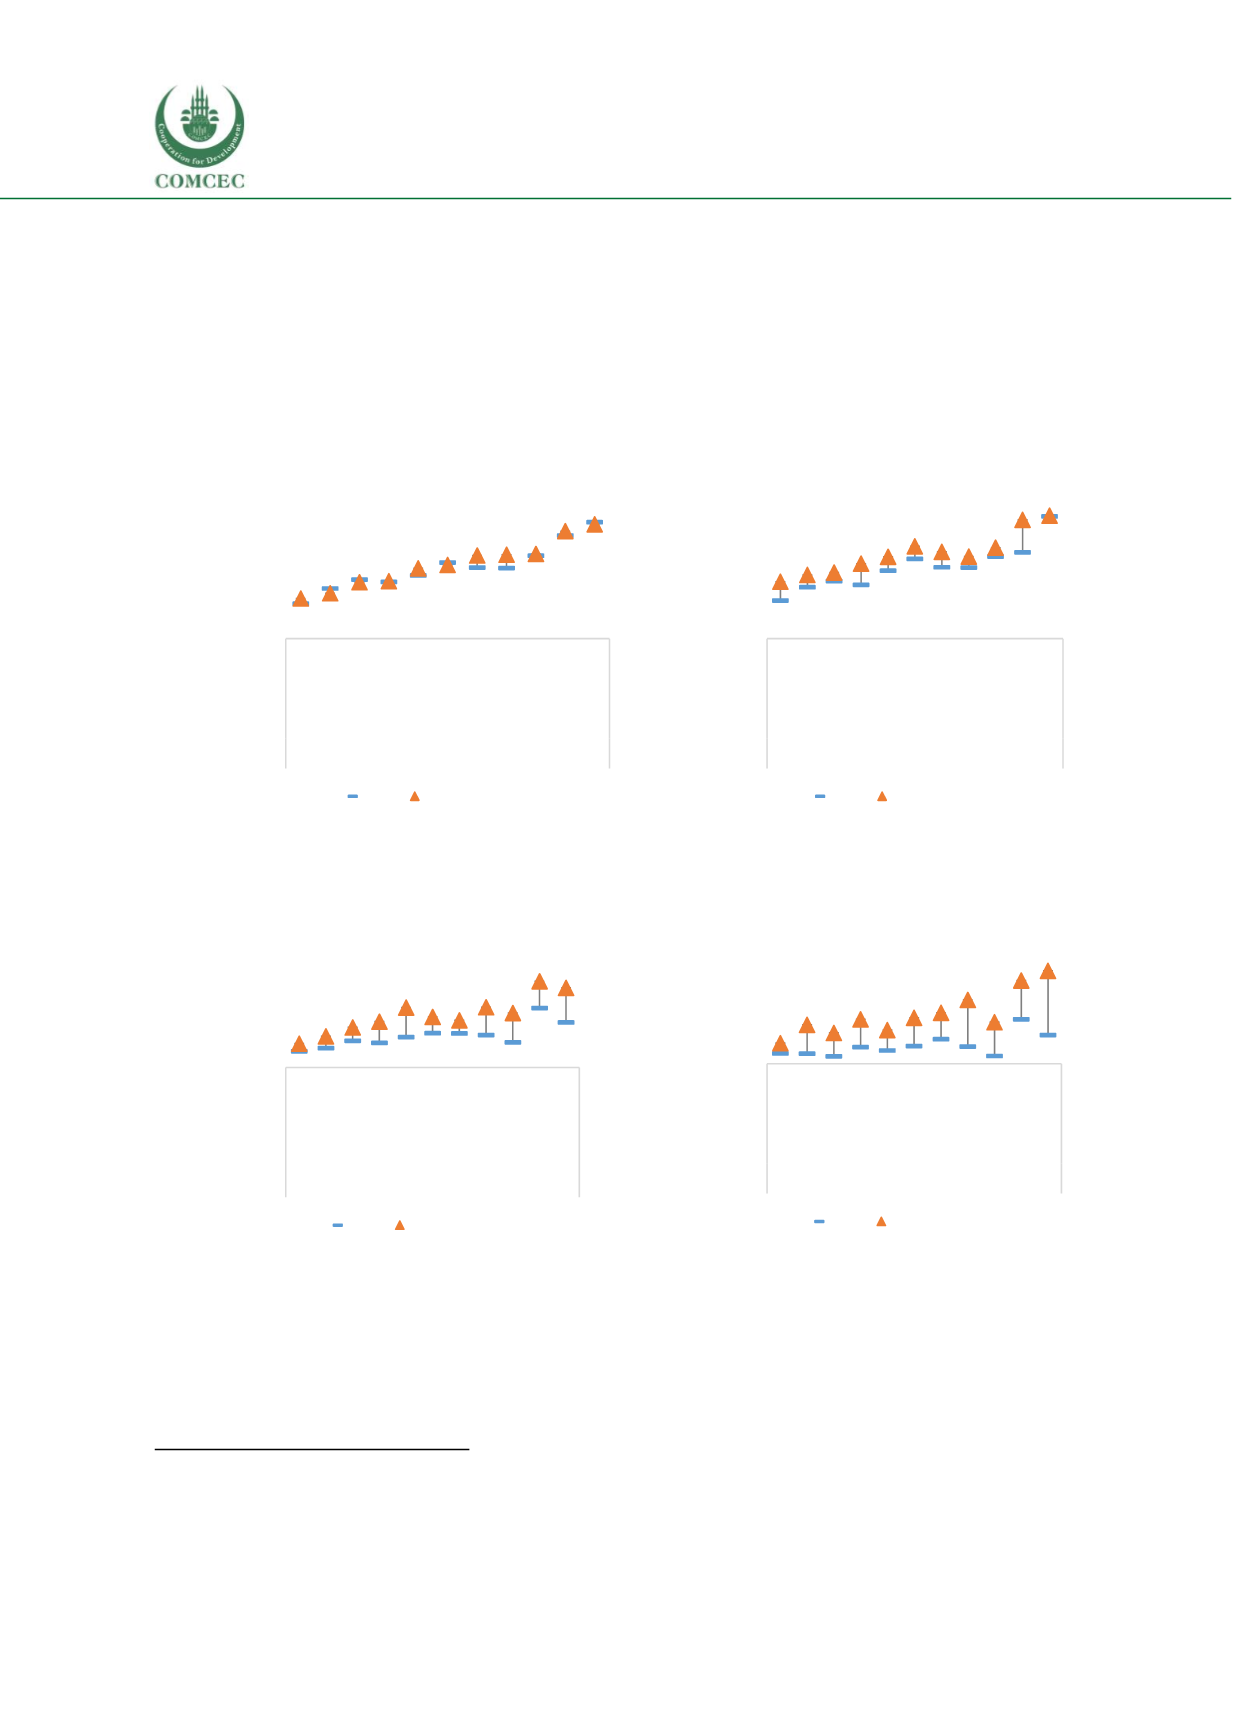
Figure 26 DHS 2005-2015 Difference in access rates by regions
219
A.
Attendance in school (6-11 year olds)
B.
Attendance in school (12-15 year
olds)
C.
Finishing 5 years of education (12-15
year olds)
D.
Finishing 8 years of education (16-18
year olds)
Note: Authors’ calculations using DHS 2005 and DHS 2015
Location/Geographic regions.
Analysis of DHS 2015 showed that Kaffrine, Djourbel, Louga,
Matam and Tambacounda are the 5 critical regions with lowest access to school rates (or
conversely, highest numbers of out of school children). While completion rates have improved
219
Given the 2008 new regional divisions, in the graphs the 2015 ‘Kaolack’ region covers the data for both Kaffrine and the new
Kaolack, the 2005 Kaolack is the old/undivided region pre-2008 and so forth.
0
20
40
60
80
100
Diourbel
Louga
Matam
Kaolack
Tambacounda
Fatick
Thies
Saint-Louis
Kolda
Dakar
Zuguinchor
Region
attendance to school for children
aged 6-11 years old (%)
2005 2015
0
20
40
60
80
100
Diourbel
Louga
Matam
Kaolack
Tambacounda
Fatick
Thies
Saint-Louis
Kolda
Dakar
Zuguinchor
Region
attendance to school for children
aged 12-15 years old (%)
2005 2015
0
20
40
60
80
100
Diourbel
Louga
Matam
Kaolack
Tambacounda
Fatick
Thies
Saint-Louis
Kolda
Dakar
Zuguinchor
Region
finishing 5 years of education (% of
12-15 year olds)
2005 2015
0
10
20
30
40
50
60
70
80
90
100
Diourbel
Louga
Matam
Kaolack
Tambacounda
Fatick
Thies
Saint-Louis
Kolda
Dakar
Zuguinchor
Region
finishing 8 years of education (% of 16-
18 year olds)
2005 2015


