
Education of Disadvantaged Children in OIC:
The Key to Escape from Poverty
65
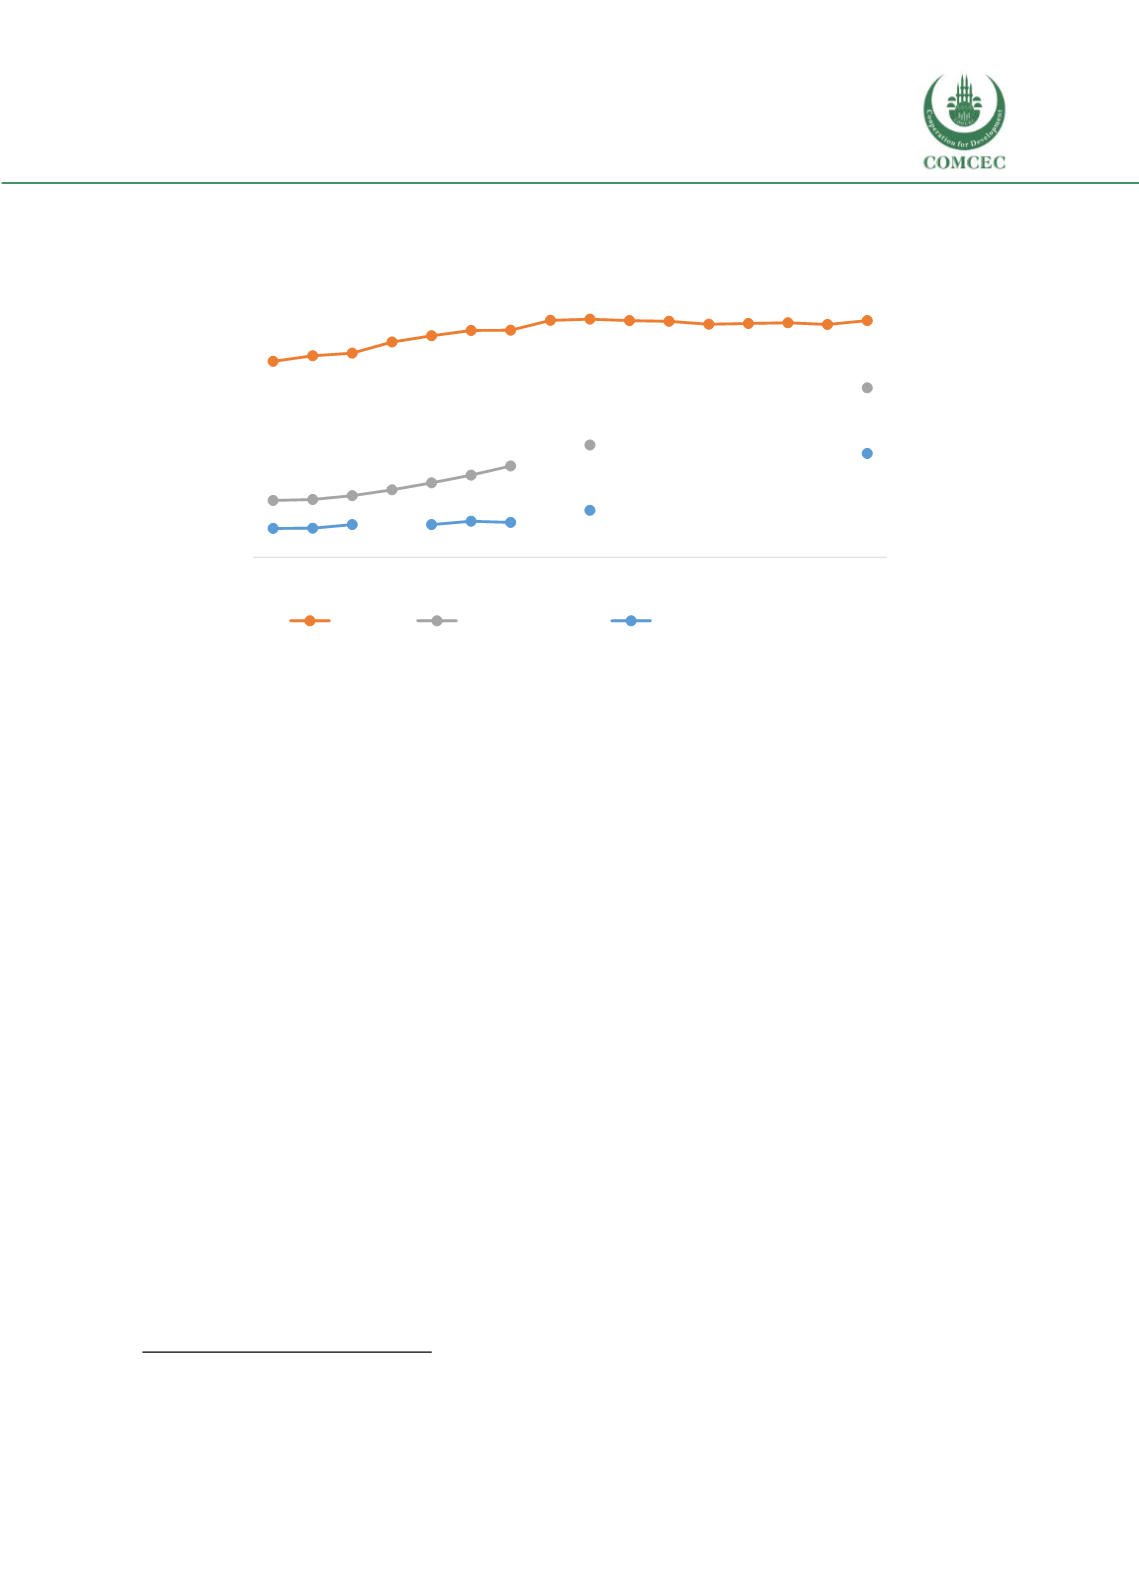
Figure 23 Gross Enrolment Rates 2000-2015
Note: UNESCO Institute of Statistics
The so-called “alternative systems” constitute an offer of education and training which compete
with demand for formal school (see section 3.1). The government of Senegal considers children
enrolled in non-formal and informal education system as ‘out-of-school’.
Improving Enrolment Rates (UNESCO and Administrative data).
Fig.2 (Chapter 2) shows that Senegal’s Net Primary Enrolment Rate has improved significantly
during 1990s-2010s and is currently around the average for low-income OIC countries, while
performing better than lower-middle-income Nigeria.
Based on administrative data
213
, the primary level overall Gross Enrolment Rate (GER) has grown
from 67.2% in 2000 to 89.4% in 2015 with a downward trend between 2007 (86.2%) and 2015.
The network of schools increased by 53.5% from 2004 to 2014, which contributed to improved
access rates. In terms of quality/performance, Senegal improved the learning environment by
reducing pupil/teacher ratio and reaching one of the lowest pupil/teacher ratios (at the primary
level) in the region with 31.3 students per teacher. The primary completion rate has grown
slightly (going from 60.1% in 2012 to 60.3% in 2013) suggesting a positive development of this
indicator. The lower secondary Gross Enrolment Rate (GER) averaged 54.6.0% to 58.4% between
2012 and 2015 and is higher for girls (61.7%) than for boys (55.2%) in 2015. Whereas for upper
secondary education, the gross enrolment ratio increased steadily between 2012 and 2015, from
25.9% to 33.2%. “Senegal has always had a sector approach to education meaning that although
secondary education has not benefited from the same level of investment as primary education,
213
Rapport des indicateurs rétropolés (2002 à 2015) DPRE/MEN (obtained from Ministry of National Education)
0
10
20
30
40
50
60
70
80
90
100
2000 2001 2002 2003 2004 2005 2006 2007 2008 2009 2010 2011 2012 2013 2014 2015
Gross enrolment ratio (%)
Primary
Lower secondary
Upper secondary


