
Education of Disadvantaged Children in OIC:
The Key to Escape from Poverty
68
Looking at DHS data for 2015, attendance rates for 6-11 years and 12-15 years old are only 50.5%
and 58.7% for families that have 5 or more children (Se
e Table 3). These access rates increase by
18.7 percentage points and 15.6 percentage points respectively if the family has only 1 or 2
children. These significant differentials can be noticed also in the completion rates of 5 years of
schooling and 8 years of schooling.
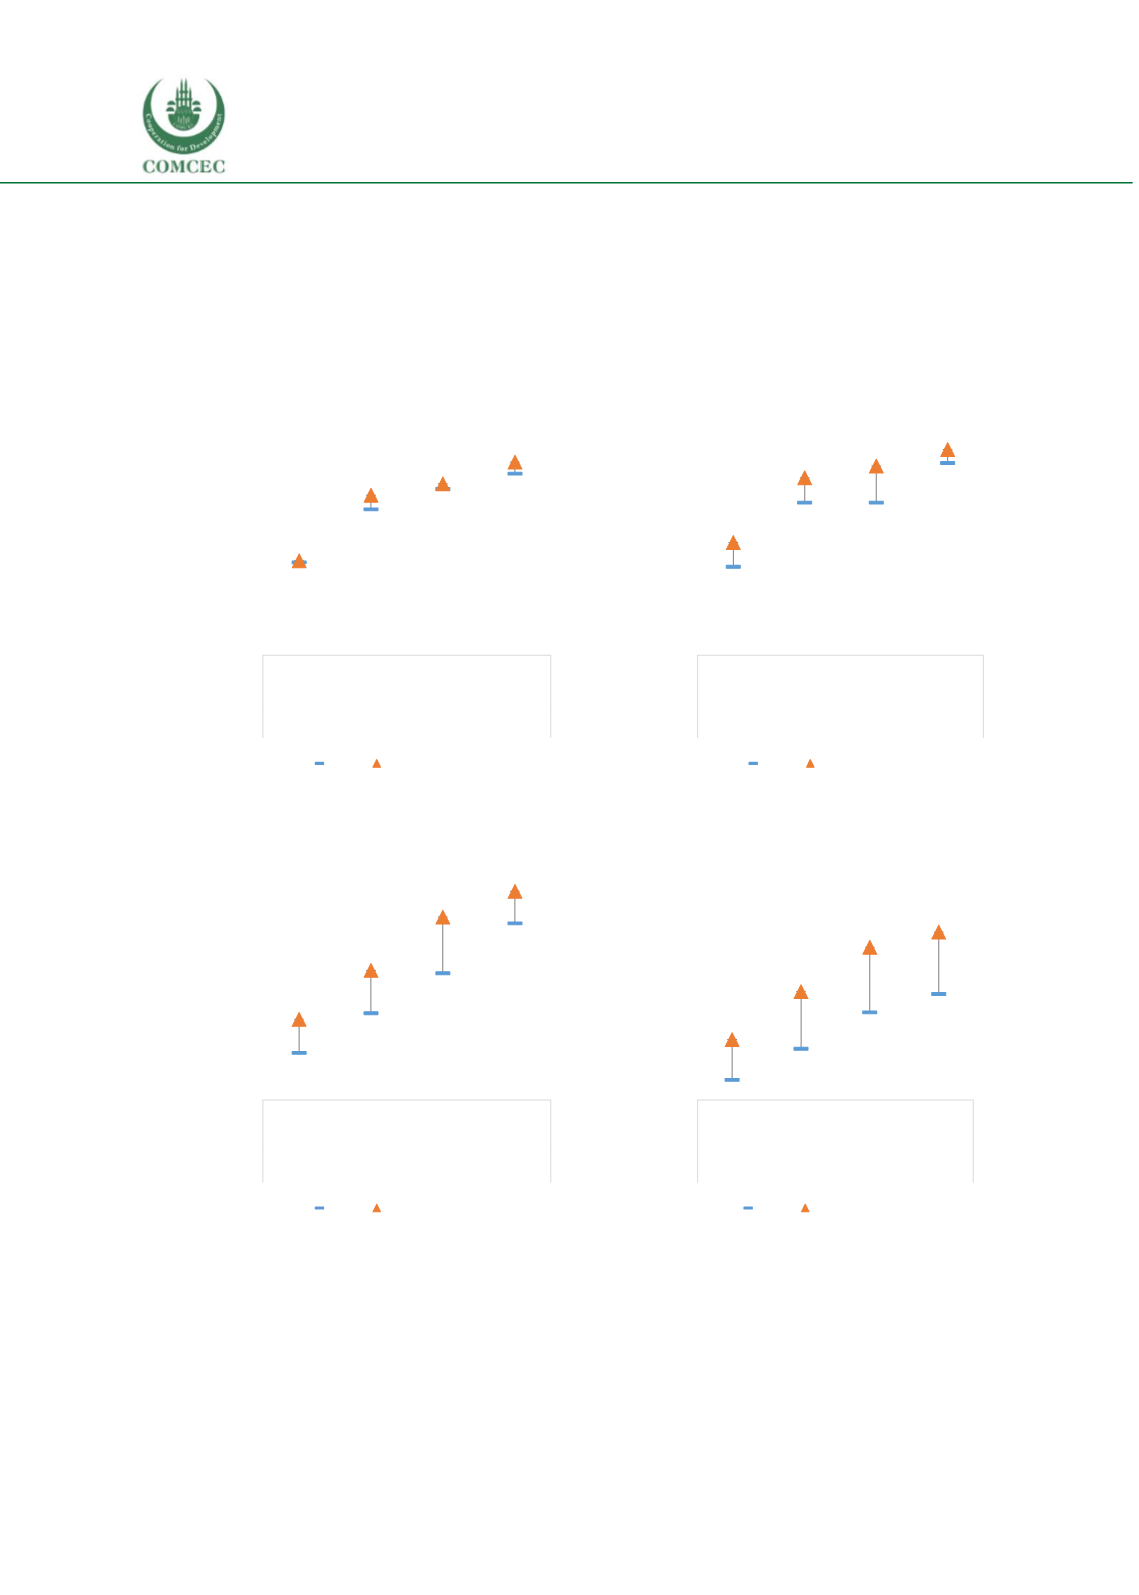
Figure 25 Education outcomes by household head’s level of education
A.
Attendance in school (6-11 year olds)
B.
Attendance in school (12-15 year olds)
C.
Finishing 5 years of education (12-15
year olds)
D.
Finishing 8 years of education (16-18
year olds)
Note: Authors’ calculations using DHS 2005 and DHS 2015
Education of Head of Household:
In 2015, attendance rates for children with parents with no
education stands at 45.7% and 54.6% for 6-11 and 12-15 year olds respectively (See Figure 3). If
the head of household finishes higher education, those rates increase very substantially by 47.7
percentage points and 44.9 percentages points up to 93.4% (6-11 year olds) and 99.5% (12-15
0
10
20
30
40
50
60
70
80
90
100
No
education
Primary
education
Secondary
Education
Higher
Education
Household head's education
attendance to school for children aged 6-
11 years old (%)
2005 2015
0
10
20
30
40
50
60
70
80
90
100
No
education
Primary
education
Secondary
Education
Higher
Education
Household head's education
attendance to school for children aged 12-
15 years old (%)
2005 2015
0
10
20
30
40
50
60
70
80
90
100
No
education
Primary
education
Secondary
Education
Higher
Education
Household head's education
finishing 5 years of education (% of 12-15
year olds)
2005 2015
0
10
20
30
40
50
60
70
80
90
100
No
education
Primary
education
Secondary
Education
Higher
Education
Household head's education
finishing 8 years of education (% of 16-18
year olds)
2005 2015


