


 86 / 277

Education of Disadvantaged Children in OIC:
The Key to Escape from Poverty
76
qualifications and training to become a teacher which helped recruit larger numbers of teachers,
faster. Increased spending was directed towards hiring teachers. However, while successful in
terms of access, this policy led to a lowering of the quality of education through fewer university
qualified teachers in the system. As seen in Chapter 2, in terms of percentage of teachers trained
in primary school, Senegal is around the median for low-income OIC and should be doing better
given its level of resource investments.
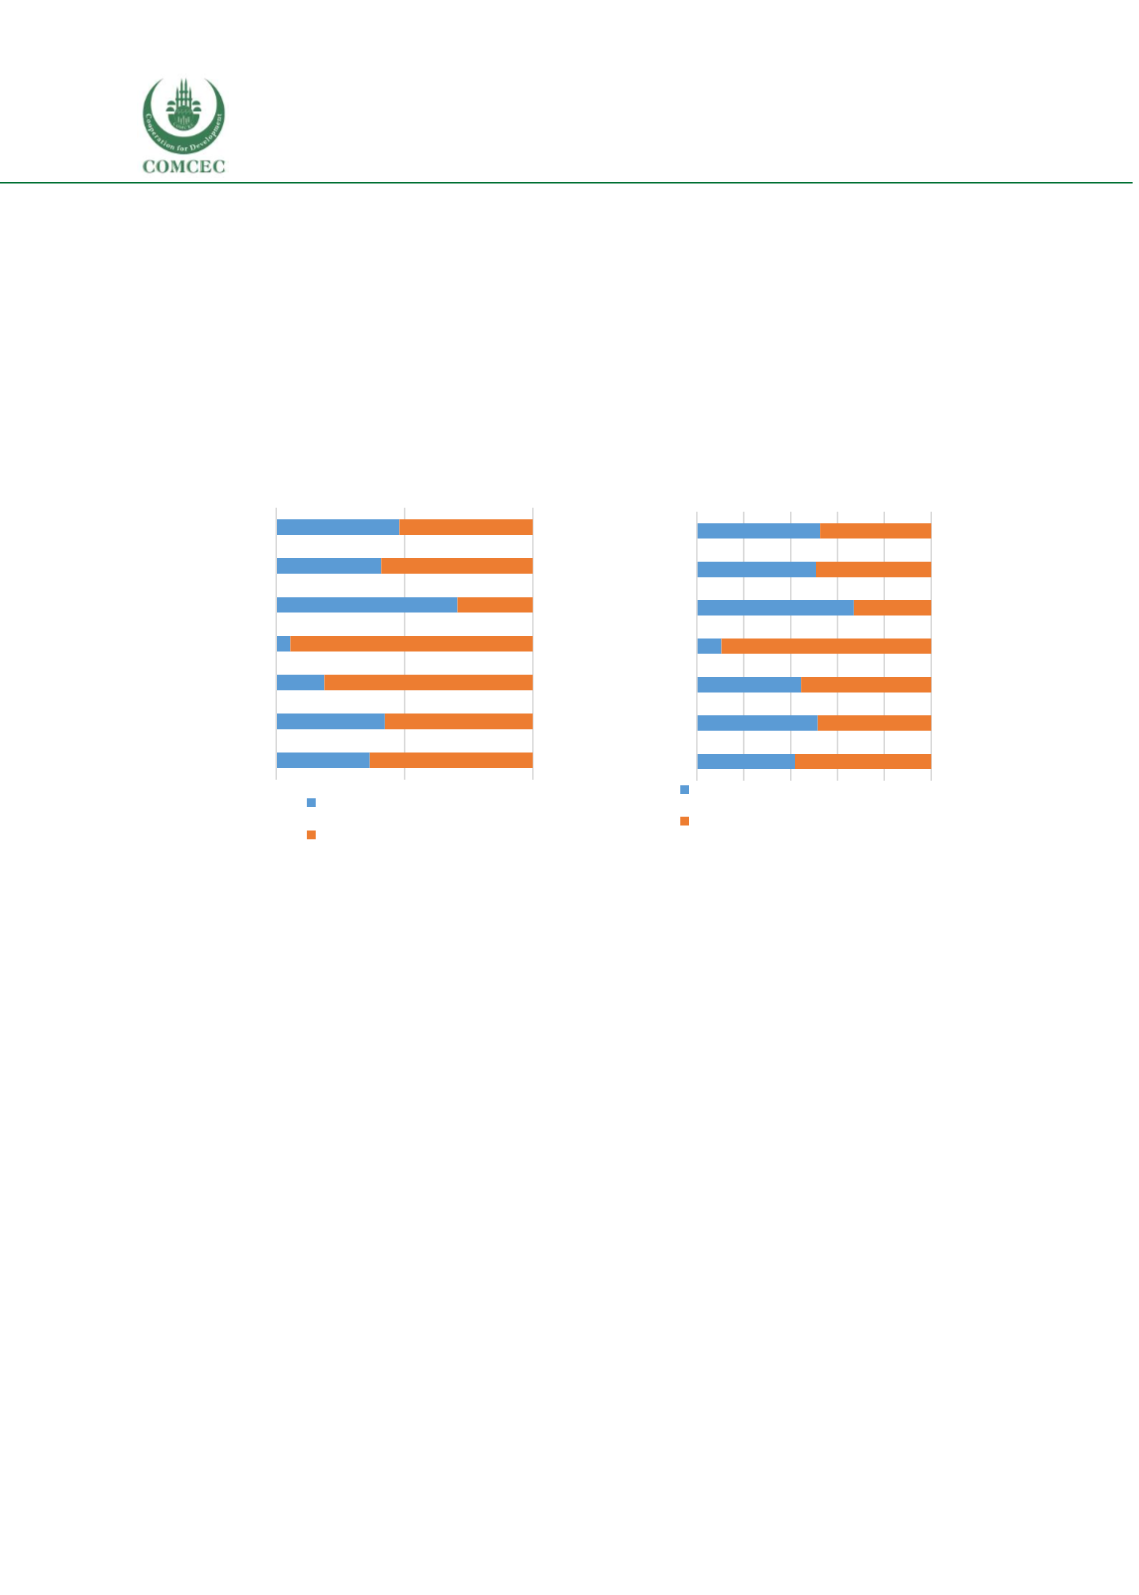
Figure 30 The distribution of students (percentage) according to the number of books per
child
A.
Beginning of primary cycle
B.
End of primary cycle
Note: CONFEMEN (2014)
As PASEC results show, there are disparities within Senegalese regions (see
Figure 33section
3.2.2 “Design and incentives”) and between early primary and end of primary school. In the North
and South-East, the proportion of pupils whose teacher has a university degree is close to 20% at
the beginning of schooling. It goes up to 36% for end of schooling in the North and in a more
dramatic change, it goes up to 78% for end of schooling in the South-East.
The trend is somewhat reversed in the South-West zone (lowest performing region), where 40%
of pupils have teachers with master degrees at the beginning of schooling but then it goes down
to only 23% by end of schooling.
Therefore the lowest performing region has the least share of teachers with university degrees at
the end of schooling. The regions with lowest enrolment/attendance such as the Centre have less
qualified teachers at the beginning of the cycle than at the end.
These observations call into question the rules that guide the allocation of teachers between sub-
cycles from one region to another.
Learning environments.
From PASEC, the regions with lowest performance are South-East and
South-West, they also correspond to the regions that have the fewest manuals available to
48
40,9
70,6
5,5
18,7
42,3
36,4
52
59,1
29,4
94,5
81,3
57,7
63,6
0
50
100
North
West
Center
Southeast
Southwest
National
International
one book per child
less than one book per child
52,6
50,8
67
10,5
44,5
51,6
41,9
47,4
49,2
33
89,5
55,5
48,4
58,1
0 20 40 60 80 100
North
West
Center
Southeast
Southwest
National
International
one book per child
less than one book per child