


 58 / 277

Education of Disadvantaged Children in OIC:
The Key to Escape from Poverty
48
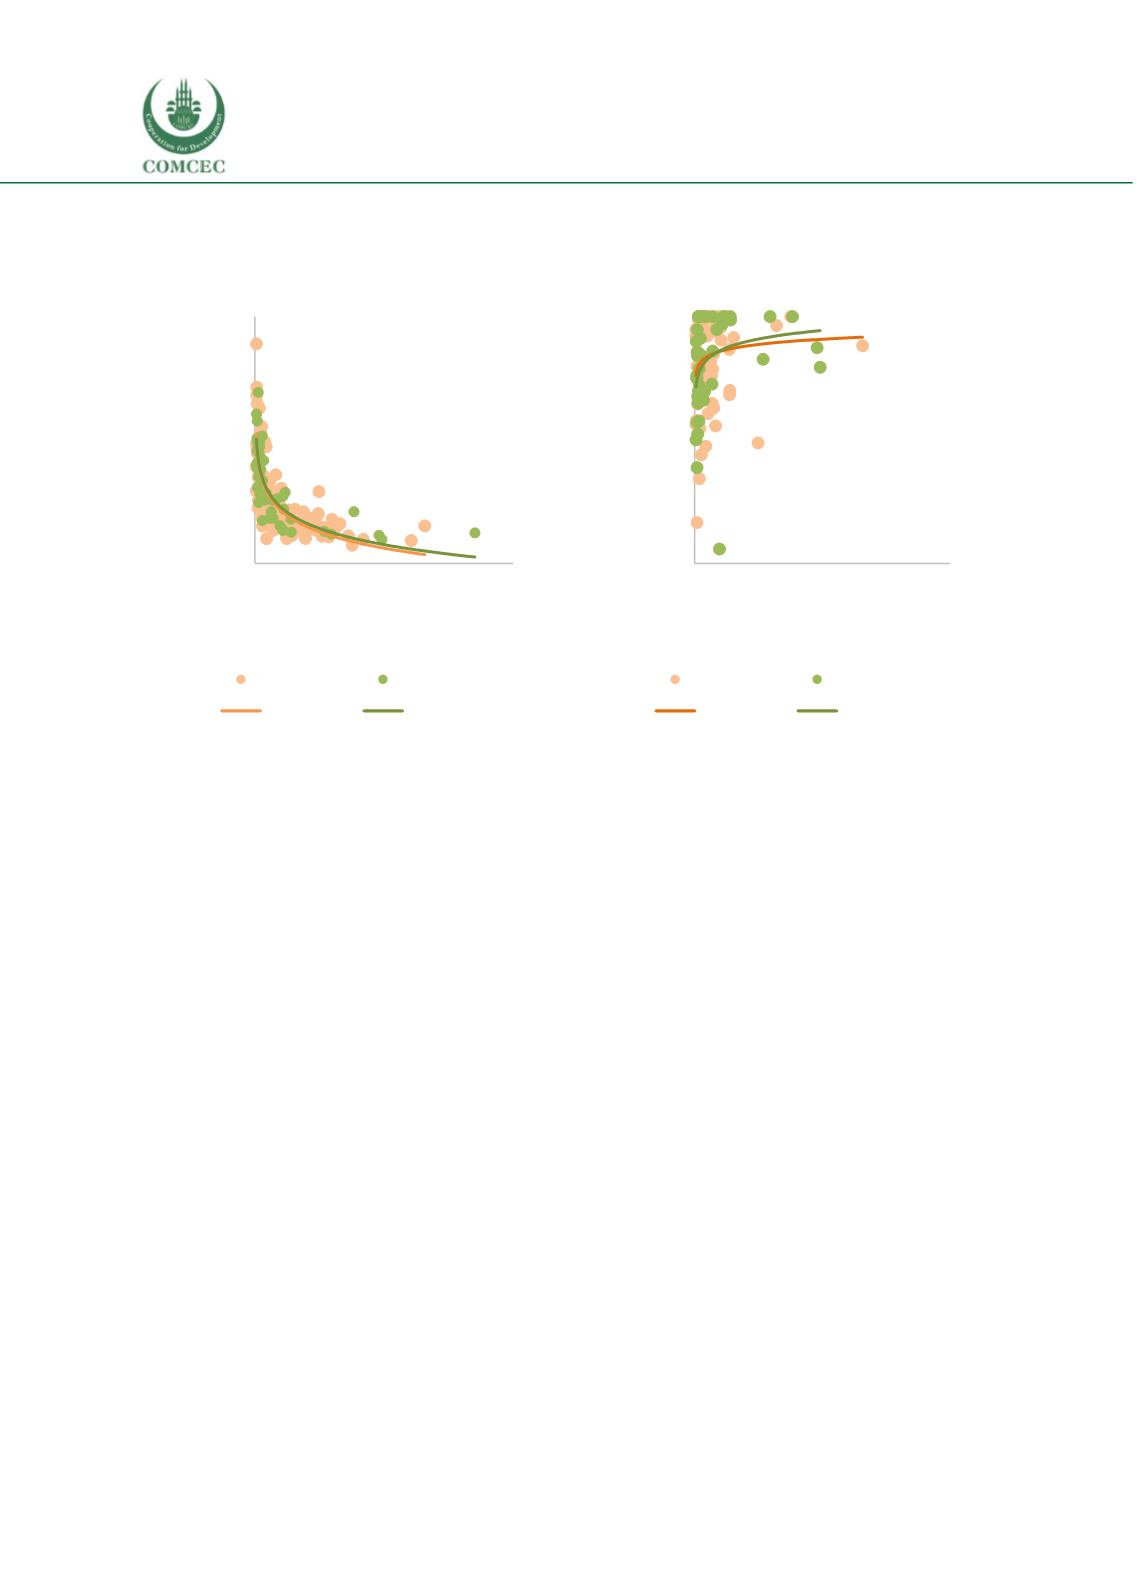
Figure 18 Human resources vs GDP per capita
A.
Pupil teacher ratio vs GDP per capita
B.
Trained teacher ratio vs GDP per capita
Note: Data is obtained from World Bank Education Statistics database. Education data is for the last year
available between 2010 and 2016 while GDP per capita data is for year 2010. 49 OIC and 119 non-OIC countries
are represented for Panel A while 42 OIC and 63 non-OIC countries are represented for Panel B.
As well as teacher shortages, the quality of teaching staff is a widespread problem across
OIC countries
(See
Figure
19
Percentage of teachers in primary education who are
trained, both sexes (%)
).y = -8,585ln(x) + 101,95
y = -8,505ln(x) + 102,33
0
10
20
30
40
50
60
70
80
90
0
50.000 100.000 150.000
Pupil-teacher ratio in primary education
(headcount basis), 2010-2016
GDP per capita, PPP (constant 2011
international $), 2010
non-OIC
OIC
Log. (non-OIC)
Log. (OIC)
y = 3,0422ln(x) + 56,656
y = 5,0753ln(x) + 37,432
0
10
20
30
40
50
60
70
80
90
100
0
50.000 100.000 150.000
Percentage of teachers in primary education who
are trained, both sexes (%) 2010-2016
GDP per capita, PPP (constant 2011
international $) 2010
non-OIC
OIC
Log. (non-OIC)
Log. (OIC)