


 63 / 277

Education of Disadvantaged Children in OIC:
The Key to Escape from Poverty
53
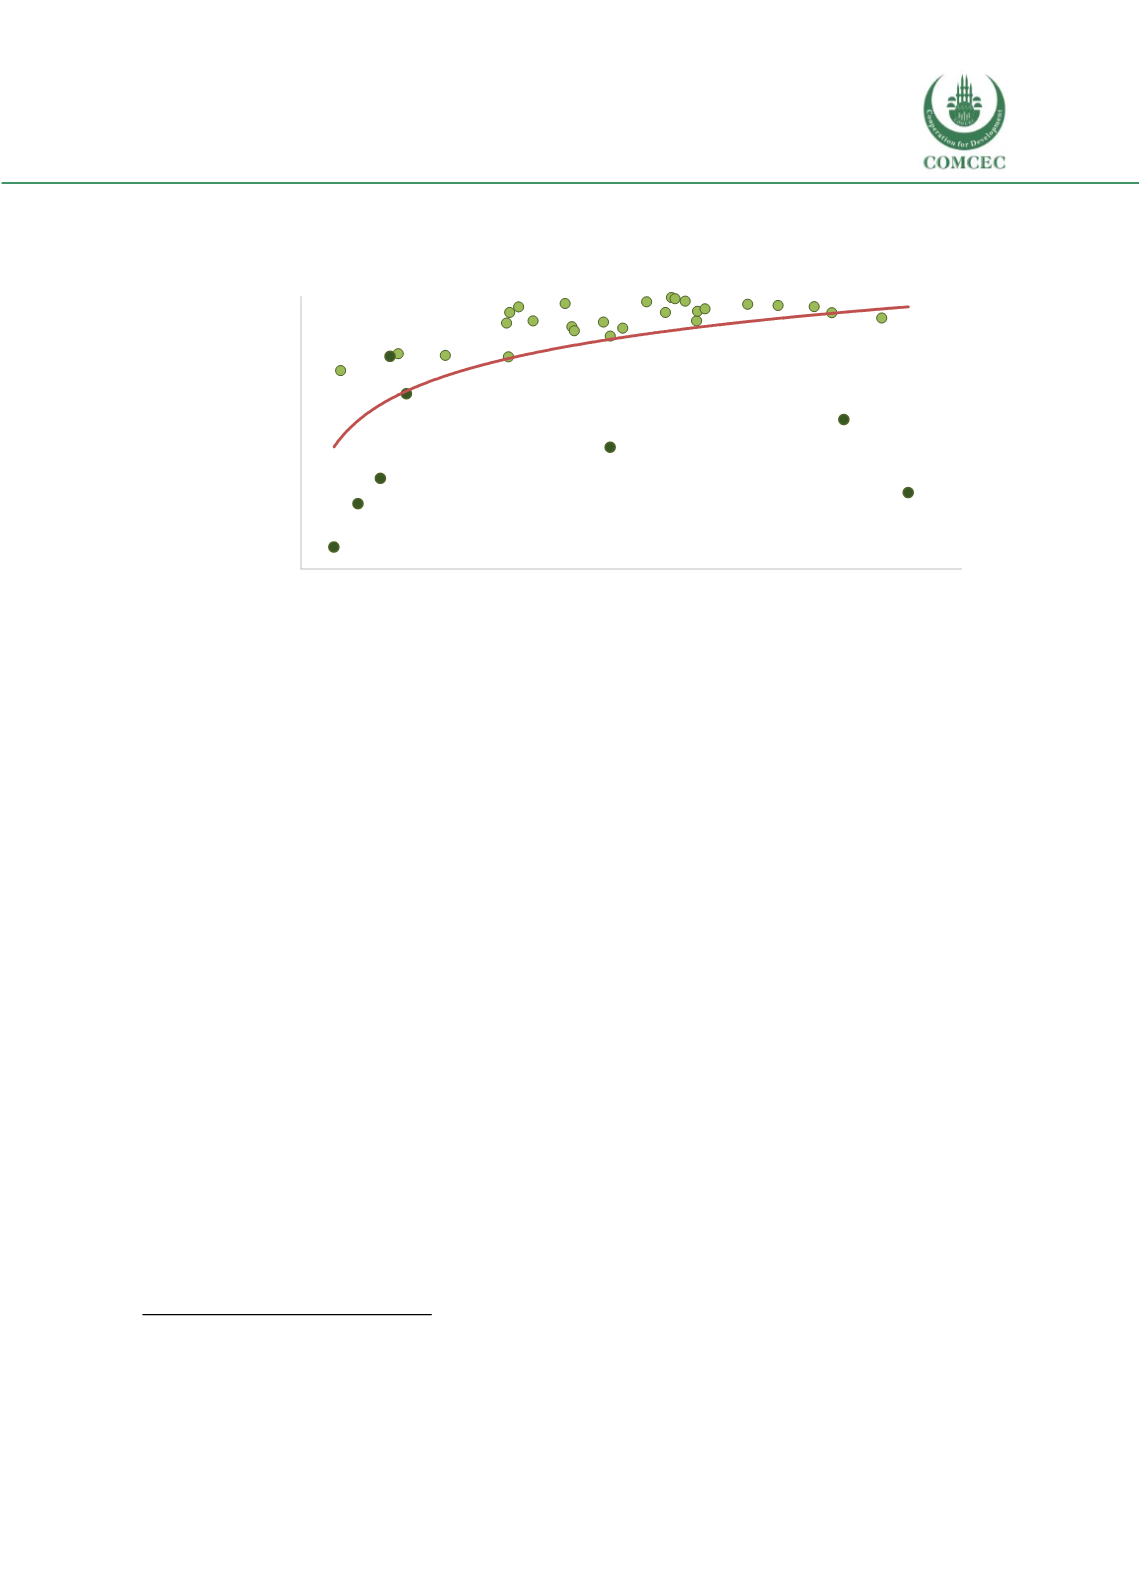
Figure 22 Achievement in TIMSS 2011 mathematics test vs government expenditure per
primary student (2011)
Note: Government expenditure per primary student is obtained from UNESCO Institute of Statistics' database and
it is for year 2011 except for Qatar, Tunisia and Turkey. For Qatar expenditure data is for year 2009, for Tunisia it
is for year 2008 and for Turkey it is for year 2013. Achievement in mathematics is obtained from UNESCO's WIDE
database and it represents the percentage of students passing the lowest benchmark (400) in TIMSS 2011 for 4th
graders in primary school. A total of 35 countries are presented here. These are the countries that have data on
both indicators. Non-OIC countries represented here are: Georgia, Morocco, Romania, Chile, Hungary, Thailand,
Czech Republic, Lithuania, Slovakia, Portugal, Malta, Poland, Serbia, New Zealand, Spain, Germany, Italy,
Netherlands, Japan, Finland, Australia, Ireland, Slovenia, Denmark, United States of America, Austria, Sweden,
Norway. OIC countries are: Yemen, Morocco, Tunisia, Turkey, Iran (Islamic Republic of), Oman, Qatar, Kuwait.
In fact, participating OIC countries should actually be achieving better outcomes given the
level of government expenditure on education.
A positive relation is seen between
government expenditure per child at the primary level and achievement of the country in TIMSS
2011 as proxied by percent of children passing the lowest benchmark (Se
e Figure 22). For OIC
countries with data available, in both low or lower middle-income member countries (Yemen,
Tunisia, Morocco) and high-income member countries (Oman, Qatar, Kuwait), the money spent
on education per child seems not to give the expected results. These countries should actually be
achieving better results given the money spent per child. Only in Turkey and Iran, government
expenditure per child gives the expected results signalling that an increase in budget might
achieve even better outcomes.
148
However in the rest of the countries increasing the money spent
per child, or the budget allocated does not seem to be a solution in and of itself in improving the
learning outcomes of children. These countries should give a priority to improving the quality of
the education provided.
148 Predicted achievement rates are obtained in Excel while drawing the figures. They are the results of the simple regression
the equation of which is provided on the graph.
Yemen
Georgia
Morocco
Tunisia
Turkey
Romania
Iran (Islamic Republic
of)
Chile
Hungary
Thailand
Czech Republic
Lithuania
Slovakia
Portugal
Malta Poland
Serbia
New Zealand
Oman
Spain
Germany Italy Netherlands
J pan Finlan
Australia
Ireland SloveniaDenmark U ited States of
America
Au tria Sweden
Qatar
Norway
Kuwait
y = 17,65ln(x) - 70,825
0
10
20
30
40
50
60
70
80
90
100
0
2.000
4.000
6.000
8.000
10.000
12.000
14.000
Percentage of children of primary
school age taking part in TIMSS 2011
math test and passing first level of
difficulty
Government expenditure per primary student (PPP$), 2011