


 56 / 277

Education of Disadvantaged Children in OIC:
The Key to Escape from Poverty
46
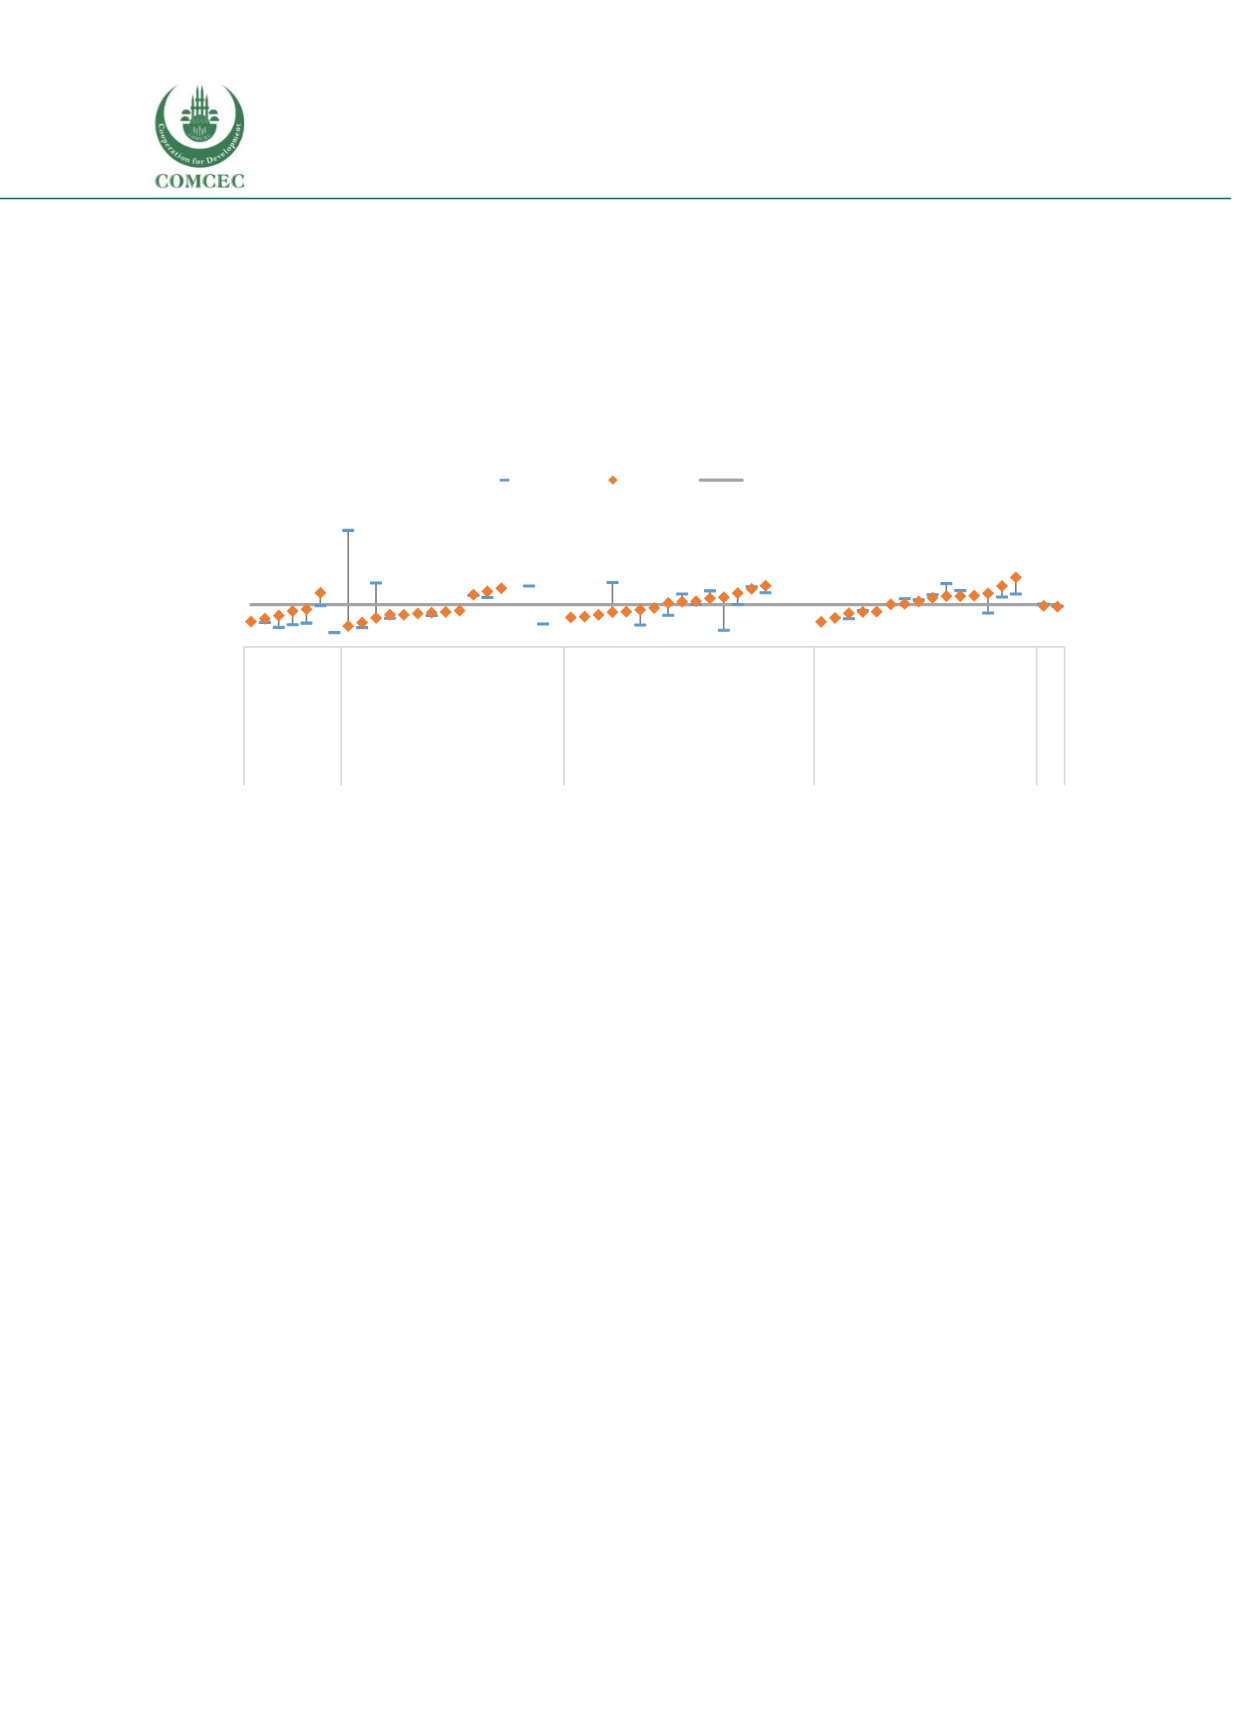
income member countries give a higher priority to education in their government budgets
compared to upper middle and high-income member countries. Among low-income member
countries with data available 10 of them (out of 15) and among lower middle-income countries 8
of them (out of 15) spend more than 15 percent of their budget on education. In contrast, among
upper middle-income countries only 3 (out of 12) and among high-income countries only 1 (out
of 6) of them are above the suggested level of 15 percent.
Figure 16 Expenditure on education as % of total government expenditure (%)
Note: Data is obtained from UNESCO Institute for Statistics' Database. To represent 1990s, for each country, the
earliest value available in the database from 1990s has been used. For 2010s, for each country, the latest value
available for 2000s has been used. Hence in a few cases latest value available could be from a year earlier than
2010. OIC average is calculated using these values for the countries with data available. Rates for the World is
obtained from World Bank World Development Indicators and are for years 1999 and 2012.
Teacher shortages continue to be a problem in many OIC countries.
In 22 countries (out of
54), for every teacher in primary education there are more than 30 students (Se
e Figure 17). Chad
and Mozambique are the countries with the highest number of students for every teacher with 62
and 55 students for each teacher in primary education respectively. In a number of member
countries namely Gabon, Bangladesh, Sierra Leone and Senegal considerable progress was seen
in the last 25 years with the pupil teacher ratio decreasing by more than 15 pupils per teacher. In
Bangladesh where the progress was the greatest, the pupil teacher ratio in primary education was
63 in 1990, dropping down to 36 by 2015. In contrast, in some countries the trend was in the
opposite direction. Gambia, Uganda and Benin are the countries where the pupil teacher ratio
increased by more than 10 students per teacher. In Benin the pupil teacher ratio was 31 in 1990,
increasing to 45 in 2015. However, national averages could mask the disparities between public
and private schools and also between schools in different regions. In Uganda the pupil-teacher
0
5
10
15
20
25
30
35
40
45
Bahrain
Brunei Darussalam
Oman
Qatar
Kuwait
Saudi Arabia
United Arab Emirates
Azerbaijan
Lebanon
Guyana
Gabon
Algeria
Kazakhstan
Albania
Turkey
Maldives
Iran (Islamic Republic of)
Malaysia
Turkmenistan
Iraq
Jordan
Libya
Suriname
Egypt
Sudan
Mauritania
Djibouti
Yemen
Pakistan
Cameroon
Bangladesh
Kyrgyzstan
Tajikistan
Morocco
Indonesia
Syrian Arab Republic
Tunisia
Côte d'Ivoire
Nigeria
Palestine
Uzbekistan
Uganda
Gambia
Guinea
Chad
Afghanistan
Sierra Leone
Comoros
Guinea-Bissau
Benin
Togo
Burkina Faso
Mali
Mozambique
Niger
Senegal
Somalia
OIC
World
High Income
Upper Middle Income
Lower Middle Income
Low Income
Expenditure on education as % of total
government expenditure (%)
1990s
2010s
15%