


 52 / 277

Education of Disadvantaged Children in OIC:
The Key to Escape from Poverty
42
gender. Moreover data collected in countries in censuses or household surveys might not be
comparable with each other due to differences in the definition of disability. Prevalence of
disability changes from survey to survey even in the same country depending on the question
asked. For instance in Uganda 7 percent of the population is disabled according to Uganda
National Household Survey 2005/2006 while the rate rises to 20 percent according to
Demographic and Health Survey 2006.
126
Lack of data and differences in the definition of disability
is a problem for OIC countries and for the world as a whole, since the extent of the problem cannot
be known and nor can accurate cross-country comparisons be made
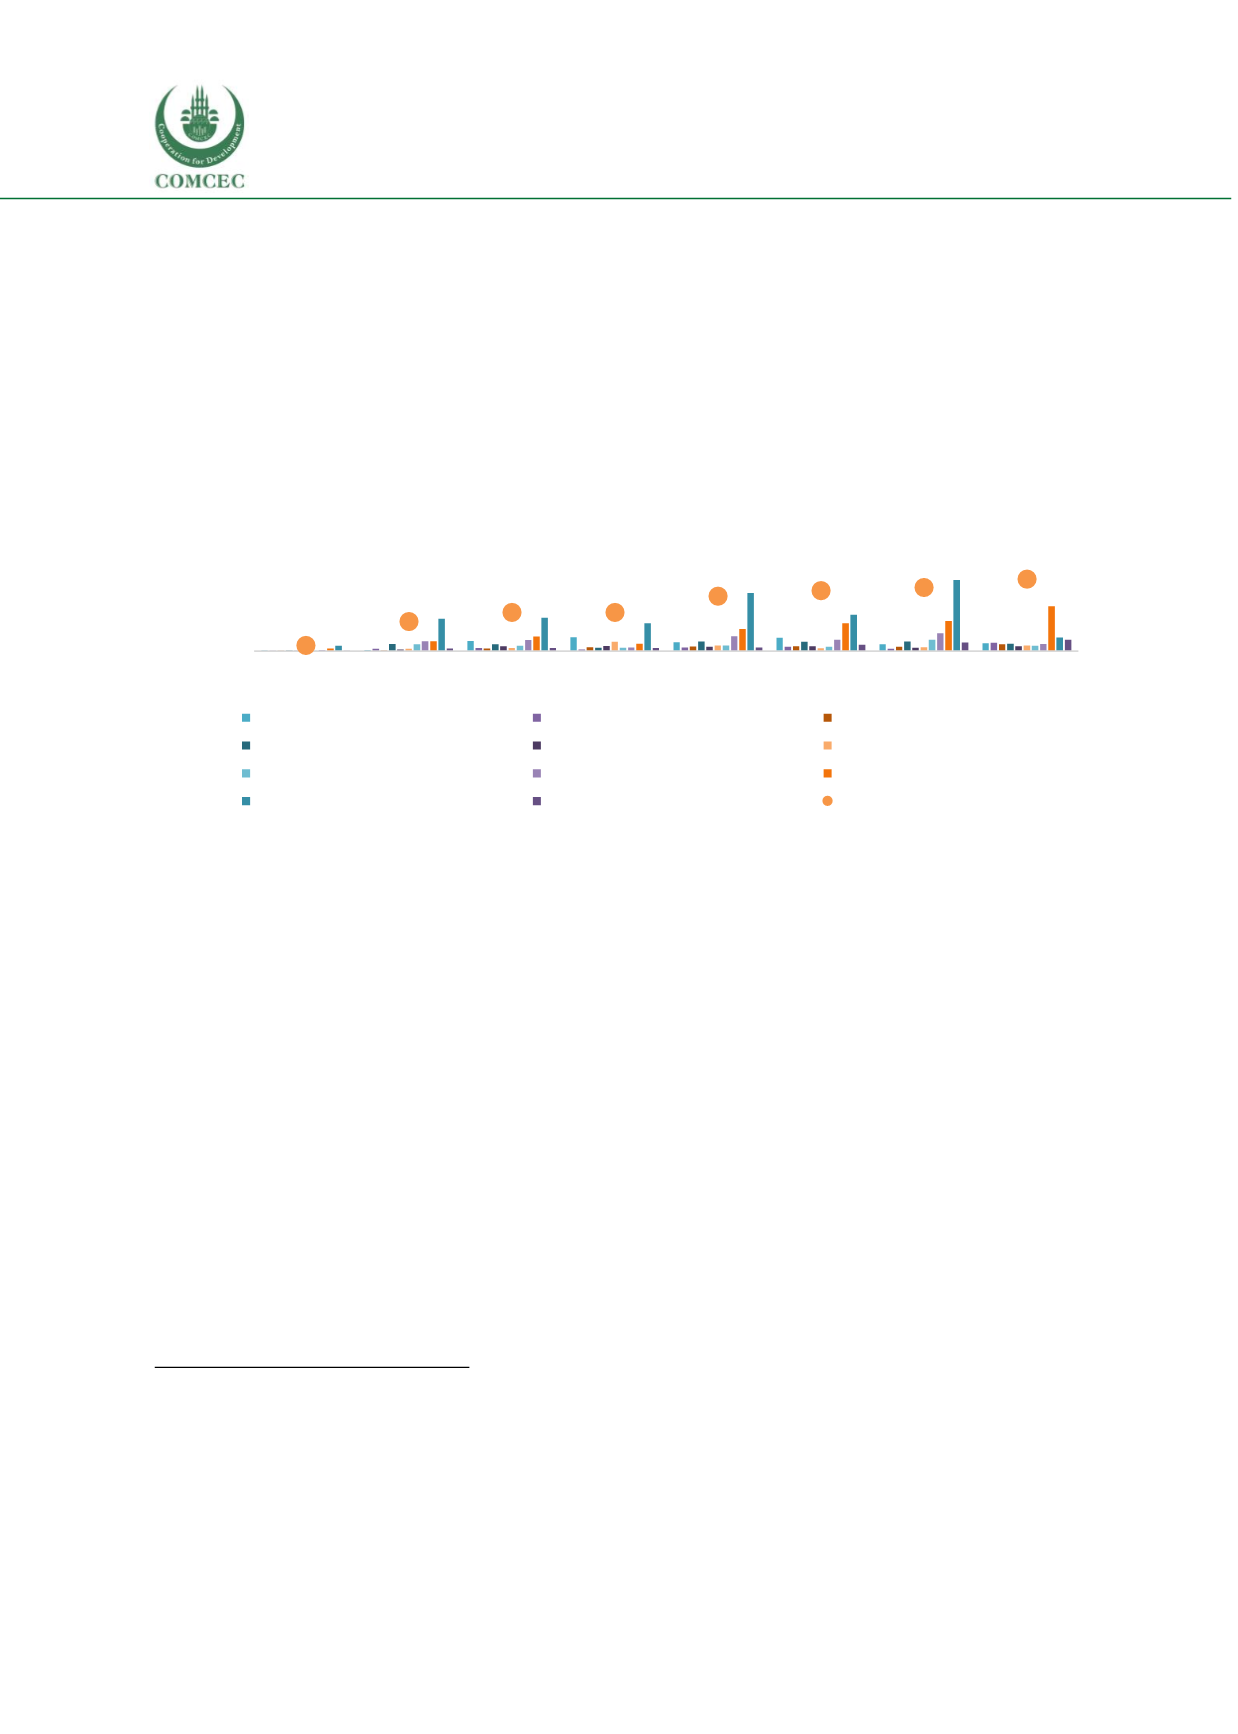
Figure 14 Disability status and disability type of children aged 2-9 in selected OIC countries
127
Note: Data is obtained from UNICEF and University of Wisconsin School of Public Health and Medicine (2008)
The third wave of Multiple Indicator Cluster Surveys (MICS) is the only survey that is
known to us to collect data on disability in a number of countries allowing for comparisons.
A report on the third wave of MICS that was collected in 2005-2006 by UNICEF presents findings
on the prevalence of disability. Among the countries included in the survey 8 OIC countries are
also present (Se
e Figure 14). The disability module screens a child as positive if there is a problem
in either one of these 10 dimensions: (i) developmental problem (i.e delay in sitting, standing or
walking), (ii) vision, (iii) hearing, (iv) comprehension, (v) movement, (vi) fits/seizures, (vii)
learning, (viii) speaking, (ix) speech, (x) intellectual impairment.
128
The results suggest that
disparity is high among participating OIC countries in the prevalence of disability among children
aged 2-9 years old. In Uzbekistan only 3.2 percent of the children were screened positive for
disability as opposed to 38.6 percent in Suriname. In Suriname the percentage is particularly high
due to 24 percent of children aged 3-9 having a problem in speech which is measured by asking
“Is (name)’s speech in any way different from normal?”.
126
UNICEF (2013a)
127
For developmental milestones the question in the survey is Compared with other children, did (name) have any serious delay
in sitting, standing, or walking?”, for speaking the question is “Does (name) speak at all (can he/she make himself/herself
understood in words; can he/she say any
recognizable words)?”, for speech the question is “
Ages 3–9: Is (name)’s speech in any
way different from normal?” and “
Age 2: Can he/she name at least one object (animal, toy, cup, spoon)?”
128
UNICEF and University of Wisconsin School of Public Health and Medicine (2008)
3,2
15,9
20,8
20,9
29,5
32,5
34,2
38,6
-10
10
30
50
Uzbekistan Albania
Iraq
Bangladesh Mauritania Cameroon Sierra Leone Suriname
% of children aged 2-9
Developmental milestones
Vision
Hearing
Comprehension
Movement
Fits / Seizures
Learning
Speaking
Speech, ages 3–9 years
Speech, age 2 years
Intellectual Impairment
% Positive to the screening overall