


 47 / 277

Education of Disadvantaged Children in OIC:
The Key to Escape from Poverty
37
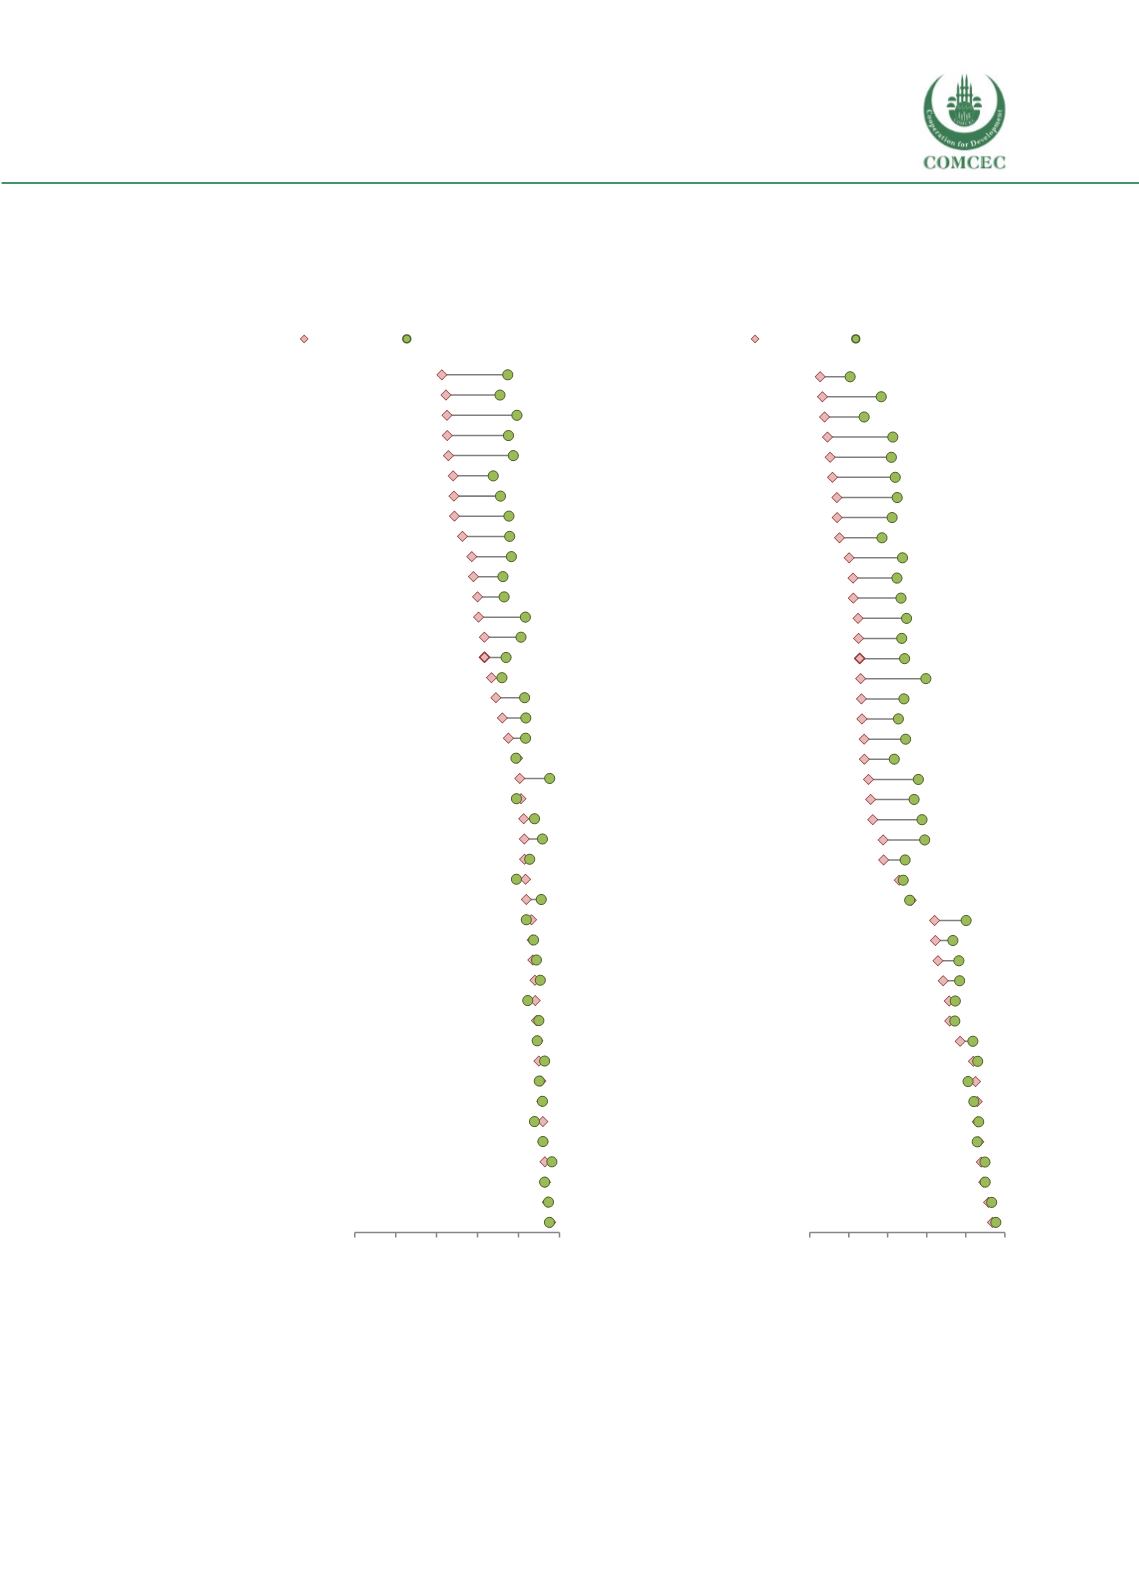
Figure 10 Net attendance rates at the primary and lower secondary education levels, by
household location
A.
Net attendance rate, primary (%)
B.
Net attendance rate, lower secondary (%)
Note: Data is obtained from UNESCO Institute of Statistics' database.
Niger 2012
Chad 2014
Burkina Faso 2010
Mali 2013
Guinea 2012
Afghanistan 2011
Mauritania 2007
Senegal 2011
Nigeria 2013
Djibouti 2006
Pakistan 2012
Gambia 2013
Sudan 2014
Yemen 2006
Côte d'Ivoire 2012
Benin 2011
Sierra Leone 2013
Mozambique 2011
Cameroon 2011
Uzbekistan 2006
Morocco 2004
Indonesia 2008
Turkey 2004
Iraq 2011
Tajikistan 2012
Guyana 2009
Togo 2014
Bangladesh 2014
Syrian Arab Republic 2006
Azerbaijan 2006
Uganda 2011
Kyrgyzstan 2012
Turkmenistan 2006
Egypt 2014
Kazakhstan 2006
Palestine 2014
Albania 2009
Gabon 2012
Maldives 2008
Suriname 2010
Jordan 2007
Tunisia 2012
Algeria 2013
0 20 40 60 80 100
% of children
Rural
Urban
Mauritania 2007
Côte d'Ivoire 2012
Chad 2014
Mozambique 2011
Burkina Faso 2010
Niger 2012
Morocco 2004
Guinea 2012
Uganda 2011
Senegal 2011
Djibouti 2006
Mali 2013
Afghanistan 2011
Sudan 2014
Sierra Leone 2013
Gabon 2012
Yemen 2006
Gambia 2013
Nigeria 2013
Pakistan 2012
Togo 2014
Iraq 2011
Cameroon 2011
Suriname 2010
Benin 2011
Bangladesh 2014
Indonesia 2008
Tunisia 2012
Turkey 2004
Maldives 2008
Guyana 2009
Egypt 2014
Syrian Arab Republic 2006
Algeria 2013
Tajikistan 2012
Uzbekistan 2006
Albania 2009
Jordan 2007
Kyrgyzstan 2012
Azerbaijan 2006
Palestine 2014
Kazakhstan 2006
Turkmenistan 2006
0 20 40 60 80 100
% of children
Rural
Urban