


 41 / 277

Education of Disadvantaged Children in OIC:
The Key to Escape from Poverty
31
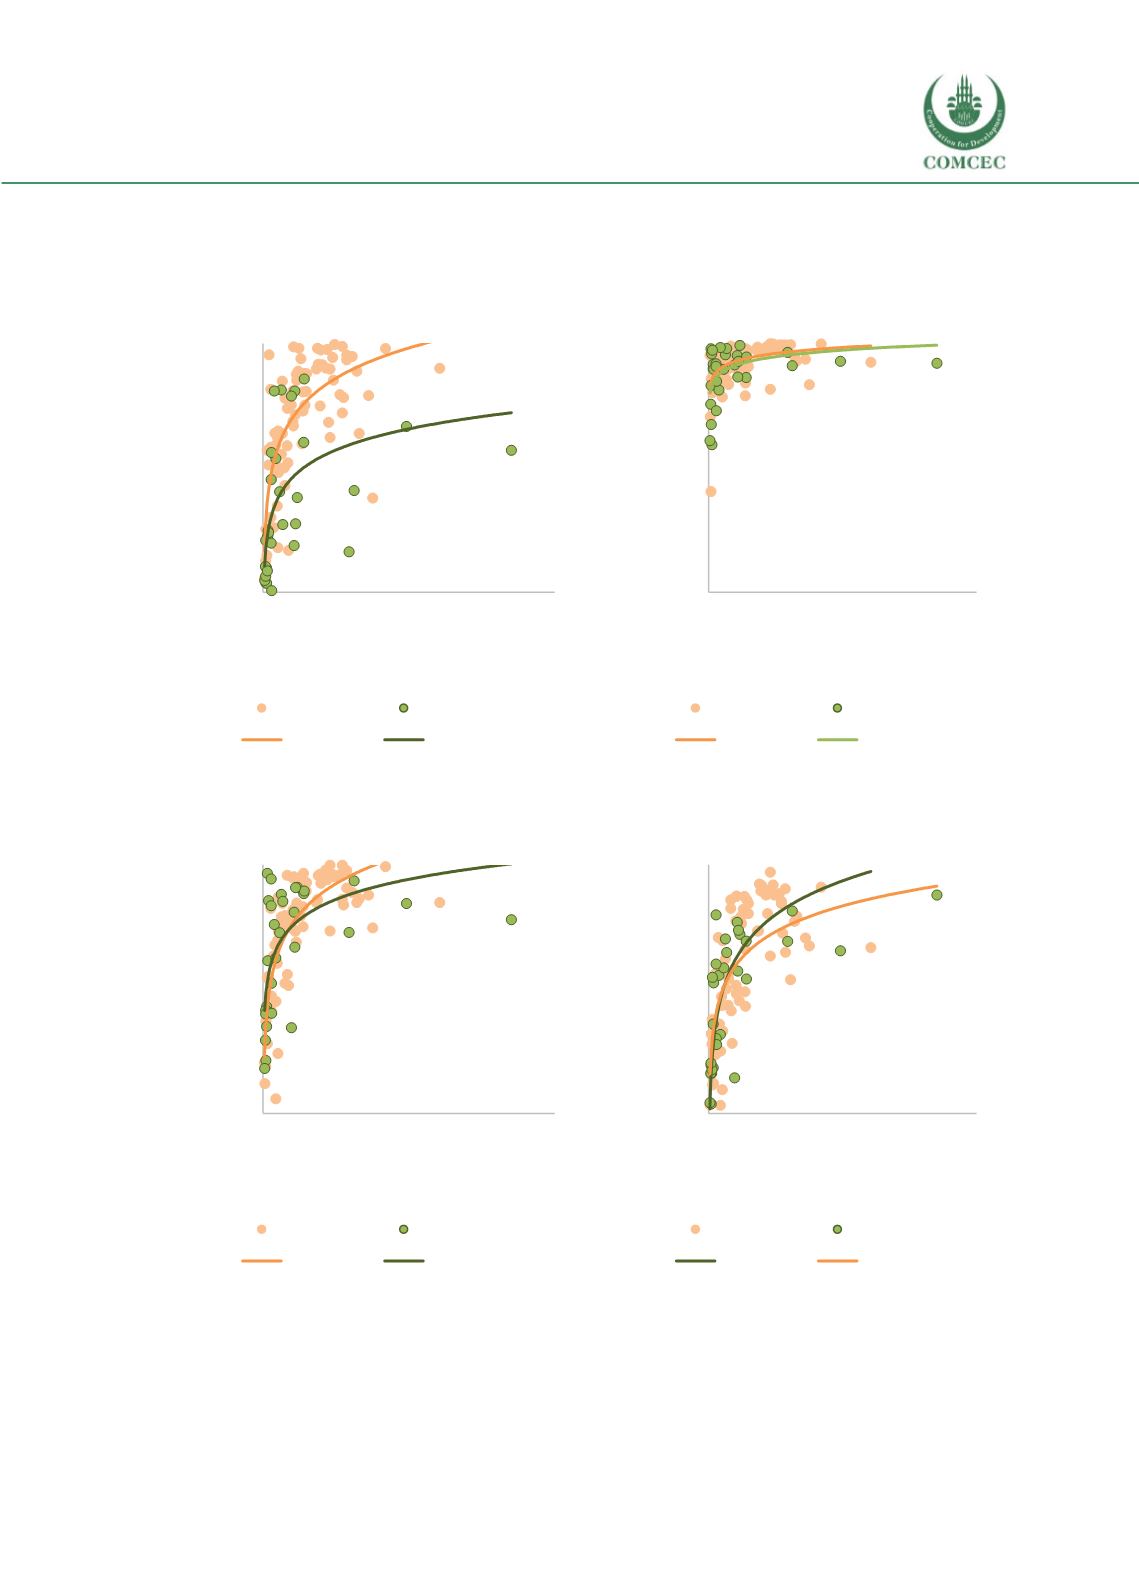
Figure 6 Enrolment rates at different education levels and GDP per capita
A.
Pre-primary net enrolment vs GDP per
capita
B.
Primary net enrolment vs GDP per
capita
C.
Lower secondary net enrolment vs GDP
per capita
D.
Upper secondary net enrolment vs GDP
per capita
Note: Data is obtained from World Bank Education Statistics database. In the graphs only the countries that have
data for all levels of education and GDP per capita (for year 2010) are included (31 OIC and 79 non-OIC countries
in total). Education data is for the last year available between 2010 and 2016 while GDP per capita data is for year
2010.
y = 17,538ln(x) - 98,61
y = 12,221ln(x) - 71,462
0
20
40
60
80
100
0
50.000
100.000
150.000
Net enrolment rate, pre-primary, both sexes (%),
2010-2016
GDP per capita, PPP (constant 2011 international $),
2010
non-OIC
OIC
Log. (non-OIC)
Log. (OIC)
y = 3,4581ln(x) + 59,62
y = 3,8149ln(x) + 54,552
0
20
40
60
80
100
0
50.000 100.000 150.000
Net enrolment rate, primary, both sexes (%), 2010-
2016
GDP per capita, PPP (constant 2011 international
$), 2010
non-OIC
OIC
Log. (non-OIC)
Log. (OIC)
y = 17,598ln(x) - 92,922
y = 11,68ln(x) - 36,915
0
20
40
60
80
100
0
50.000
100.000
150.000
Net enrolment rate, lower secondary, both sexes
(%), 2010-2016
GDP per capita, PPP (constant 2011 international $),
2010
non-OIC
OIC
Log. (non-OIC)
Log. (OIC)
y = 19,669ln(x) - 127,21
y = 14,961ln(x) - 84,45
0
20
40
60
80
100
0
50.000 100.000 150.000
Net enrolment rate, upper secondary, both sexes
(%), 2010-2016
GDP per capita, PPP (constant 2011 international
$), 2010
non-OIC
OIC
Log. (non-OIC)
Log. (OIC)