


 38 / 277

Education of Disadvantaged Children in OIC:
The Key to Escape from Poverty
28
2.
OVERVIEW OF EDUCATION IN THE OIC MEMBER STATES
2.1 GENERAL PICTURE: ACCESS TO EDUCATION BY EDUCATION LEVEL
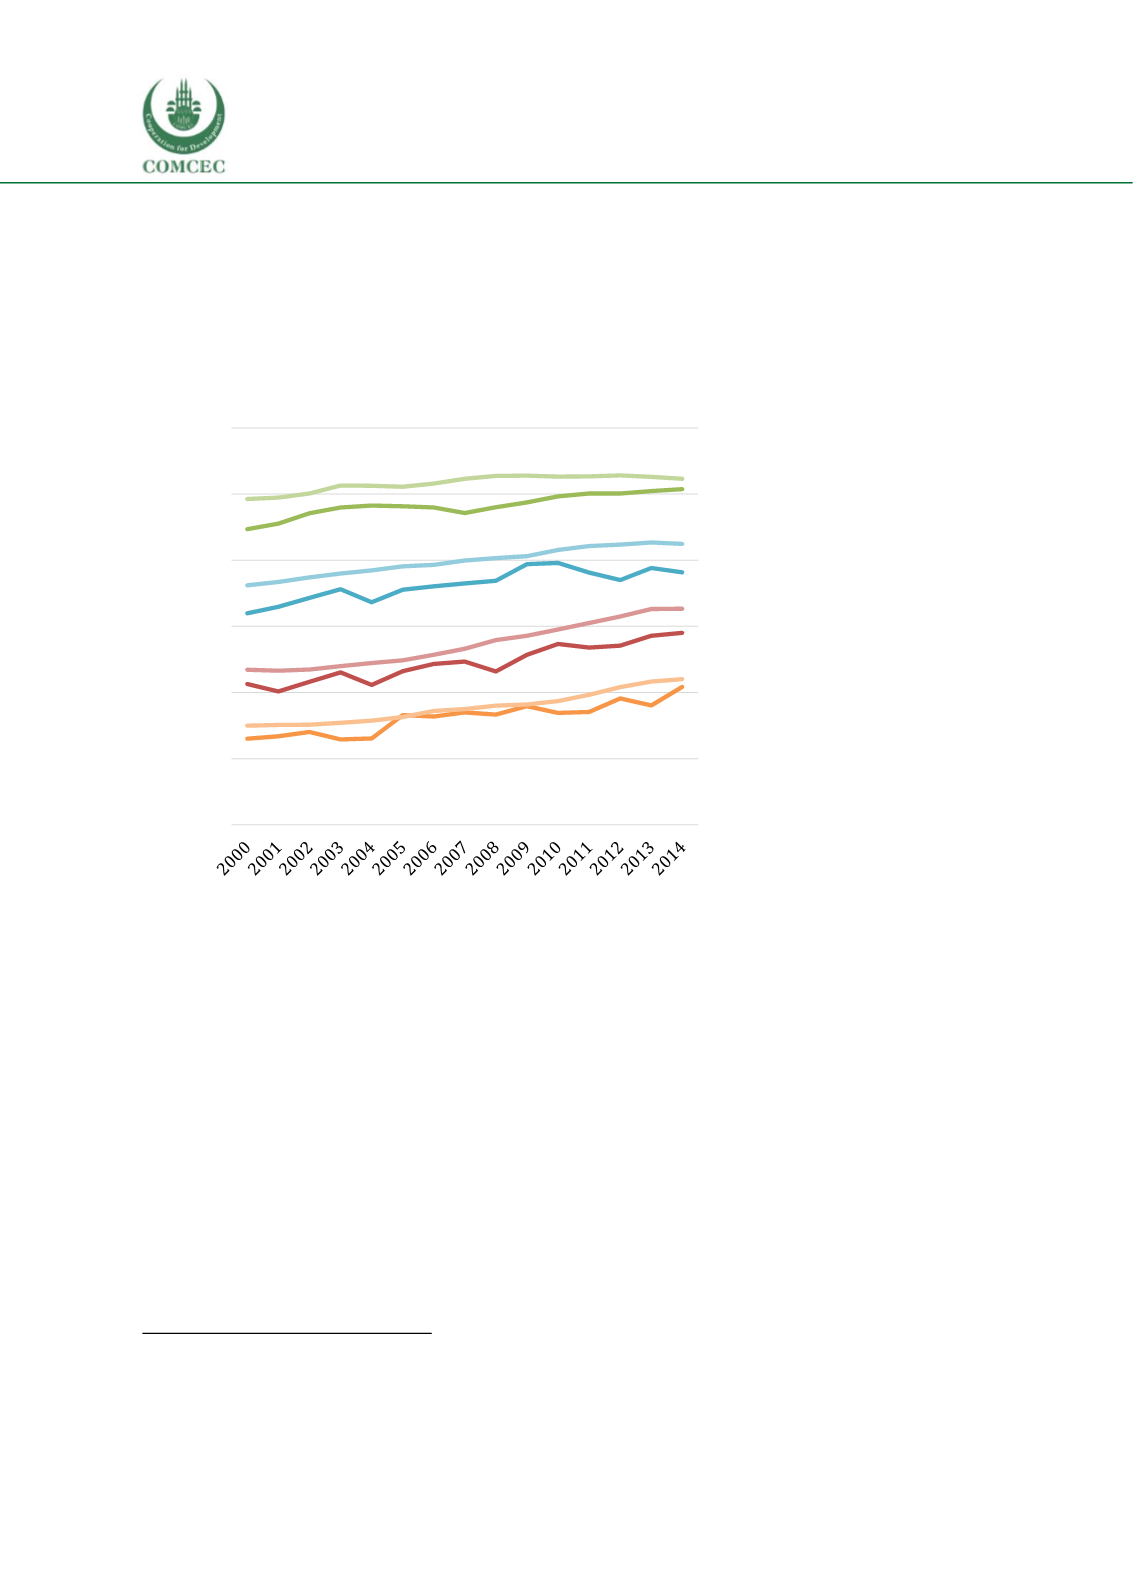
OIC countries’ average
enrolment
rates
at
different education levels
are less than but close to
the world averages
(See
Figure 3). In the last 15 years,
improvements in enrolment
at
different
levels
of
education were observed in
the OIC as can be seen in the
increases in gross enrolment
ratios.
118
Average
gross
enrolment
ratios
for
different education levels
show that participation in
education levels other than
primary remains low in the
OIC. While there has been
progress,
participation
remains especially low for
pre-primary education and
upper secondary education.
Overall, gross enrolment
ratios are the highest for
primary education and the
lowest
for
pre-primary
education.
While there has been progress over the years, universal primary education has not been
achieved in a considerable number of member countries
(Se
e Figure 4). In 24 countries (out
of 50 countries with data available), net enrolment rates at the primary level are lower than 90
percent. Enrolment rates are generally high in high-income and upper middle-income member
countries. In comparison, among lower middle-income and low-income member countries wide
variation is observed in primary net enrolment rates. In Sierra Leone, Benin, and Togo, which are
all low-income countries, primary net enrolment rates are close to being universal with 95 out of
118
Gross enrolment ratio is a measure of participation in the system calculated by dividing the total number of children attending
the education level with the population of children in the relevant age group that should be attending that education level.
Figure 3 Gross enrolment ratios of different education levels,
both sexes (%)
Note: Data is obtained from UNESCO Institute for Statistics' Database. OIC
average is calculated using the values for the countries that has data
available for each year. Hence in each year number of countries included in
the average or the list of countries might change. World averages are
obtained directly from the database as it is reported.
0
20
40
60
80
100
120
Gross enrolment ratio, both sexes
Lower
secondary
Upper
secondary
Pre-
primary
World
OIC
World
OIC
World
OIC
World
OIC
Primary