


 40 / 277

Education of Disadvantaged Children in OIC:
The Key to Escape from Poverty
30
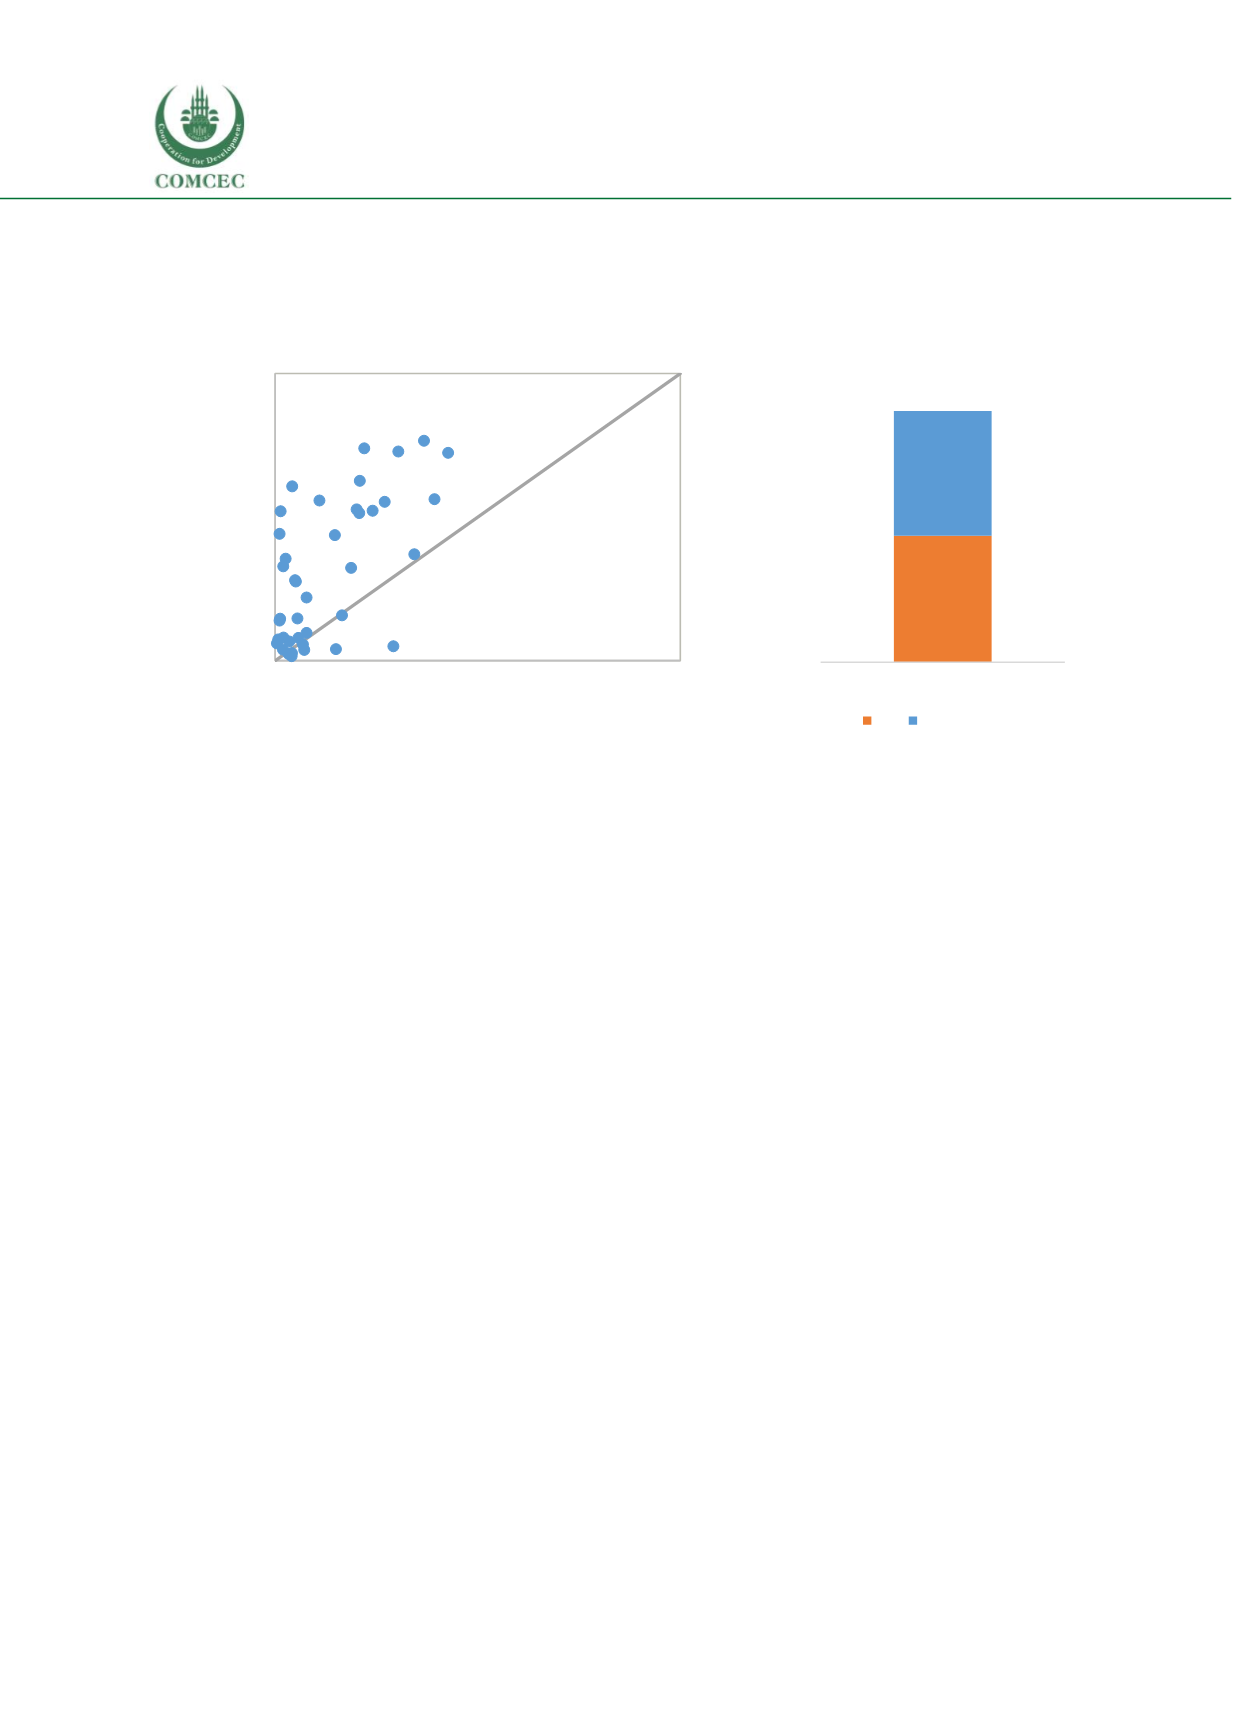
Figure 5 Out of school children of primary school age
Rate of out-of-school children of primary school age, both
sexes (%)
Total number of out of school children
in primary school age in the OIC
Note: Data is obtained from UNESCO Institute for Statistics' Database. To represent out of school rates for 1990s,
for each country, the earliest value available in the database from the 1990s has been used. For the 2010s, for each
country, the latest value available for 2000s has been used. Hence in a few cases latest value available could be
from a year earlier than 2010. For the number of out of school children data available for OIC countries for the
years stated was summed up. Note that the list of countries with data available might be different between the
1990s and the 2010s. To come up with total value for non-OIC countries total value for OIC was subtracted from
the value reported for the World.
Country income is indeed related to enrolment rates but some OIC countries manage to
perform better than predicted by their income levels.
The positive correlation between
country income and enrolment rates among the OIC countries also exist for non-OIC countries
(Se
e Figure 6 Panel A, B, C, D). The positive correlation is somewhat smaller for OIC countries for
enrolment in pre-primary and lower secondary education while it is higher for enrolment in
upper secondary education compared to the positive correlation between GDP per capita and
enrolment rates in non-OIC countries. Due to generally high primary school enrolment rates in
most of the OIC countries, enrolment in primary school is less correlated with country income
compared to other education levels (See
Figure 6Panel B). As can be seen i
n Figure 6Panel B,
countries in all income levels are predicted to have primary net enrolment rates higher than 80
percent. In contrast enrolment to other levels of education is correlated more with GDP per capita
of the country (See
Figure 6Panels A, C and D). Yet it can be seen that some countries are
performing better than predicted by their income levels at different education levels. In pre-
primary education, Guyana and Malaysia excel at achieving net enrolment rates higher than 80
percent. In lower secondary education, Uzbekistan and Tajikistan are among the countries with
net enrolment rates higher than 90 percent. In upper secondary education, Uzbekistan and
Turkey have enrolment rates higher than 70 percent. In contrast high-income countries Oman,
Saudi Arabia, Qatar and Kuwait performworse than predicted by their GDP per capita in different
education levels.
Algeria
Bangladesh
Benin
Burkina Faso
Chad
Comoros
Djibouti
Gambia
Guinea
Guyana
Indonesia
Iraq
Jordan
Kuwait
Lebanon
Mali
Mauritania
Morocco
Mozambique
Niger
Nigeria
Oman
Palestine
Qatar
Senegal
Syrian Arab
Republic
Yemen
0
10
20
30
40
50
60
70
80
90
100
0
20
40
60
80
100
rate of out of school children of primary school
age, 1990s
rate of out of school children of primary school age, 2010s
30,7
30,2
0
10
20
30
40
50
60
70
2010s
million children
OIC non-OIC