


 273 / 277

Education of Disadvantaged Children in OIC:
The Key to Escape from Poverty
263
region: Khyber
Pakhtunkhwa
-0.186***
-0.055** -0.124***
0.051** -0.200***
0.034 -0.092***
0.080**
(0.035)
(0.025)
(0.036)
(0.026)
(0.030)
(0.026)
(0.035)
(0.032)
region: Balochistan
-0.295***
-0.217*** -0.209***
-0.030 -0.173***
-0.078** -0.166***
-0.004
(0.043)
(0.036)
(0.060)
(0.032)
(0.041)
(0.032)
(0.033)
(0.039)
household head’s
education: No
education
-0.319***
-0.209*** -0.429*** -0.295*** -0.472*** -0.247*** -0.318*** -0.322***
(0.056)
(0.022)
(0.056)
(0.026)
(0.069)
(0.025)
(0.065)
(0.028)
household head’s
education: Primary
education
-0.192***
-0.147*** -0.292*** -0.230*** -0.312*** -0.184*** -0.242*** -0.260***
(0.067)
(0.030)
(0.064)
(0.029)
(0.054)
(0.027)
(0.040)
(0.028)
household head’s
education:
Secondary
education
-0.115*
-0.068***
-0.154** -0.089*** -0.235***
-0.063** -0.153*** -0.146***
(0.070)
(0.024)
(0.070)
(0.028)
(0.065)
(0.026)
(0.053)
(0.030)
# of children in
household: 3-4
-0.050*
-0.023
-0.015
-0.027
-0.061* -0.086***
-0.046
-0.047**
(0.030)
(0.017)
(0.037)
(0.019)
(0.034)
(0.018)
(0.036)
(0.021)
# of children in
household: 5 or
more
-0.092***
-0.057***
-0.054 -0.074*** -0.099*** -0.147*** -0.082*** -0.081***
(0.029)
(0.017)
(0.037)
(0.019)
(0.033)
(0.020)
(0.031)
(0.023)
wealth: Poorest
-0.572***
-0.504*** -0.459*** -0.477*** -0.389*** -0.474*** -0.340*** -0.494***
(0.030)
(0.041)
(0.040)
(0.033)
(0.030)
(0.026)
(0.024)
(0.022)
wealth: Poorer
-0.464***
-0.281*** -0.359*** -0.249*** -0.330*** -0.323*** -0.307*** -0.352***
(0.034)
(0.039)
(0.045)
(0.033)
(0.033)
(0.029)
(0.026)
(0.029)
wealth: Middle
-0.401***
-0.176*** -0.310*** -0.161*** -0.274*** -0.215*** -0.284*** -0.234***
(0.033)
(0.035)
(0.043)
(0.031)
(0.035)
(0.029)
(0.026)
(0.030)
wealth: Richer
-0.231***
-0.085*** -0.181*** -0.075*** -0.190*** -0.106*** -0.210*** -0.185***
(0.033)
(0.028)
(0.040)
(0.027)
(0.029)
(0.026)
(0.029)
(0.028)
language: non-Urdu
0.010
-0.072***
-0.056 -0.075***
-0.056 -0.072***
-0.025 -0.102***
(0.035)
(0.021)
(0.047)
(0.024)
(0.042)
(0.027)
(0.041)
(0.034)
gender: Female
-0.228***
-0.097*** -0.328*** -0.182*** -0.249*** -0.065*** -0.233*** -0.142***
(0.019)
(0.011)
(0.025)
(0.016)
(0.023)
(0.016)
(0.028)
(0.019)
Observations
8,703
11,972
4,397
7,273
4,424
7,279
2,591
4,686
Note: Authors’ calculations using DHS 1990 and DHS 2012. Marginal effects are reported, obtained using “dprobit”
command in STATA. Robust standard errors in parentheses. *** p<0.01, ** p<0.05, * p<0.1. Omitted groups are:
location: Urban, region: Punjab, household head’s education: Higher education, number of children in household: 1-2
children, wealth: Richest, language: Urdu, gender: Male.
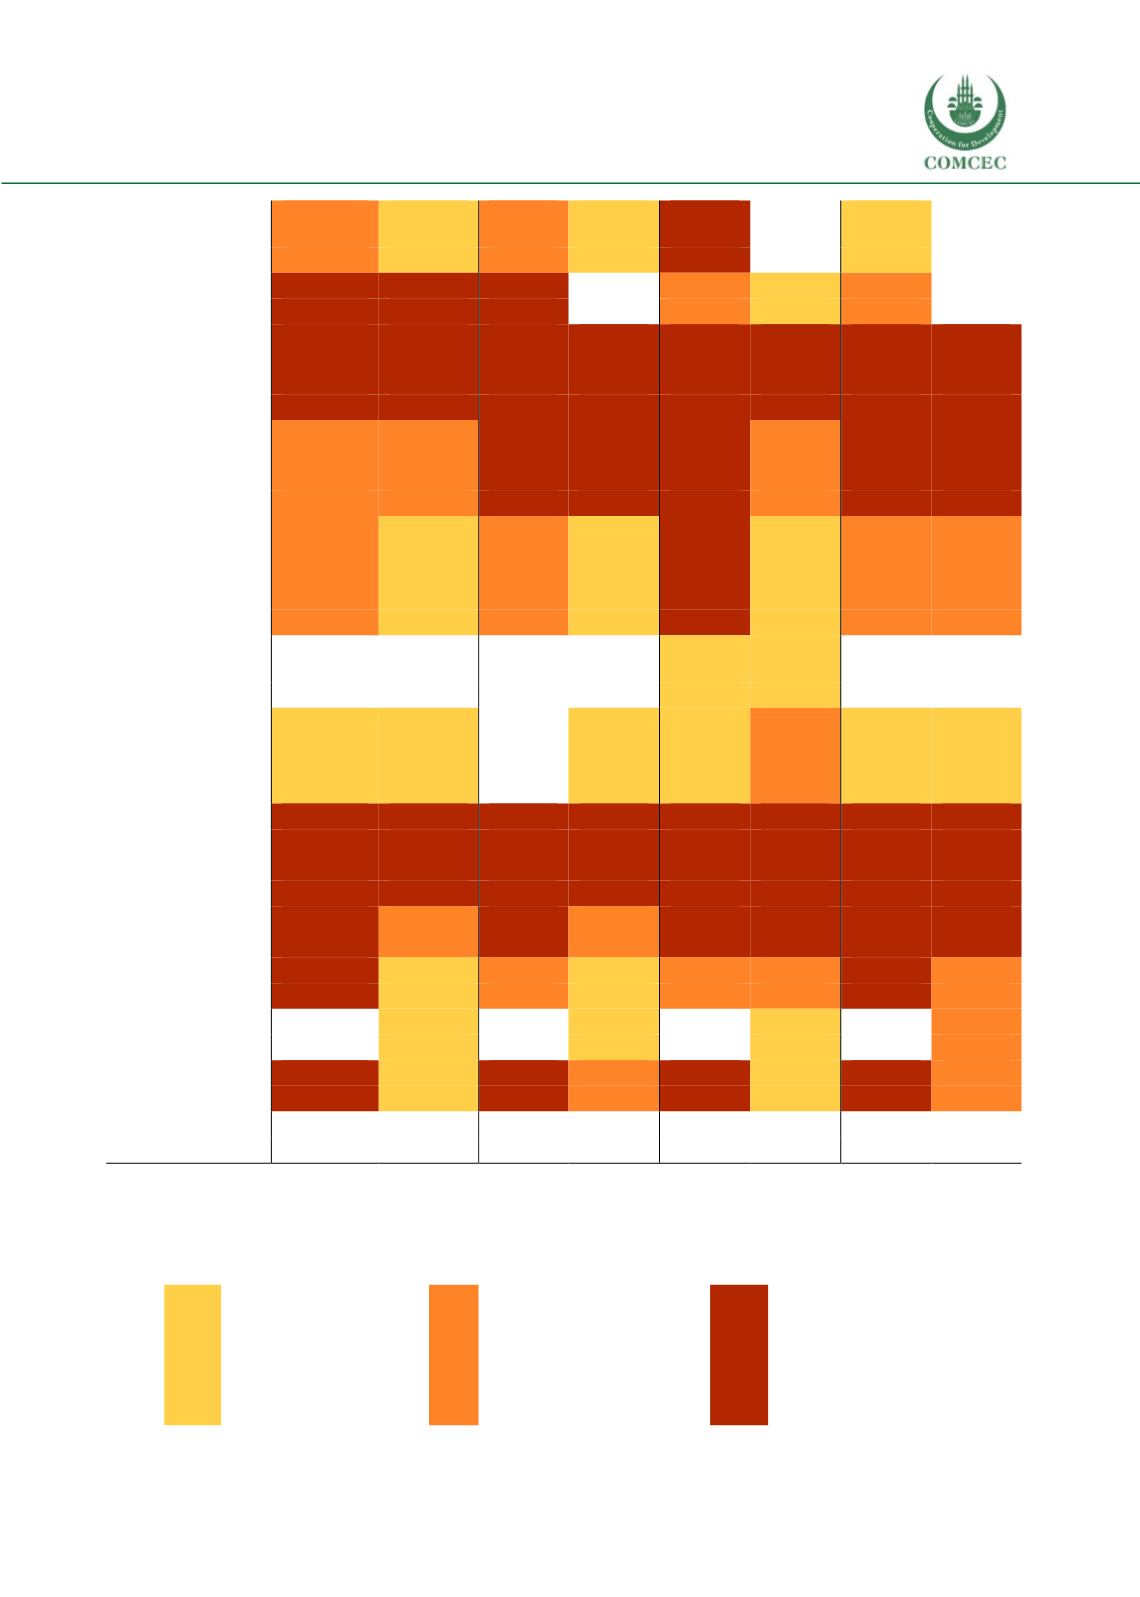
Legend
Marginal effect is
significant at least at
p<0.1 and the effect is
larger than or equal to 5.0
percent and smaller than
10.0 percent.
Marginal effect is significant
at least at p<0.1 and the
effect is larger than or equal
to 10.0 percent and smaller
than 20.0 percent.
Marginal effect is significant at
least at p<0.1 and the effect is
larger than or equal to 20.0
percent.