
Improving Road Safety
in the OIC Member States
66
matter, health related factors in general), namely the GINI coefficient, which is defined (United
Nations Development Programme, 2015) as:
“Measure of the deviation of the distribution of income among individuals or households within a
country from a perfectly equal distribution. A value of 0 represents absolute equality, a value of
100 absolute inequality”.
The GINI coefficient is used to measure inequality in income distributions. In countries with high
GINI values the majority of the income is earned by a small proportion of the populationwhereas
in countries with low GINI indices the income earned is distributed more evenly across the
entire population.
6.3.2
Mortality rates by income levels, population and vehicle ownership in OIC member
countries
Assuming that the regression line fro
m Figure 11represents a meaningful average relationship
between mortality and income levels (pcGNI),
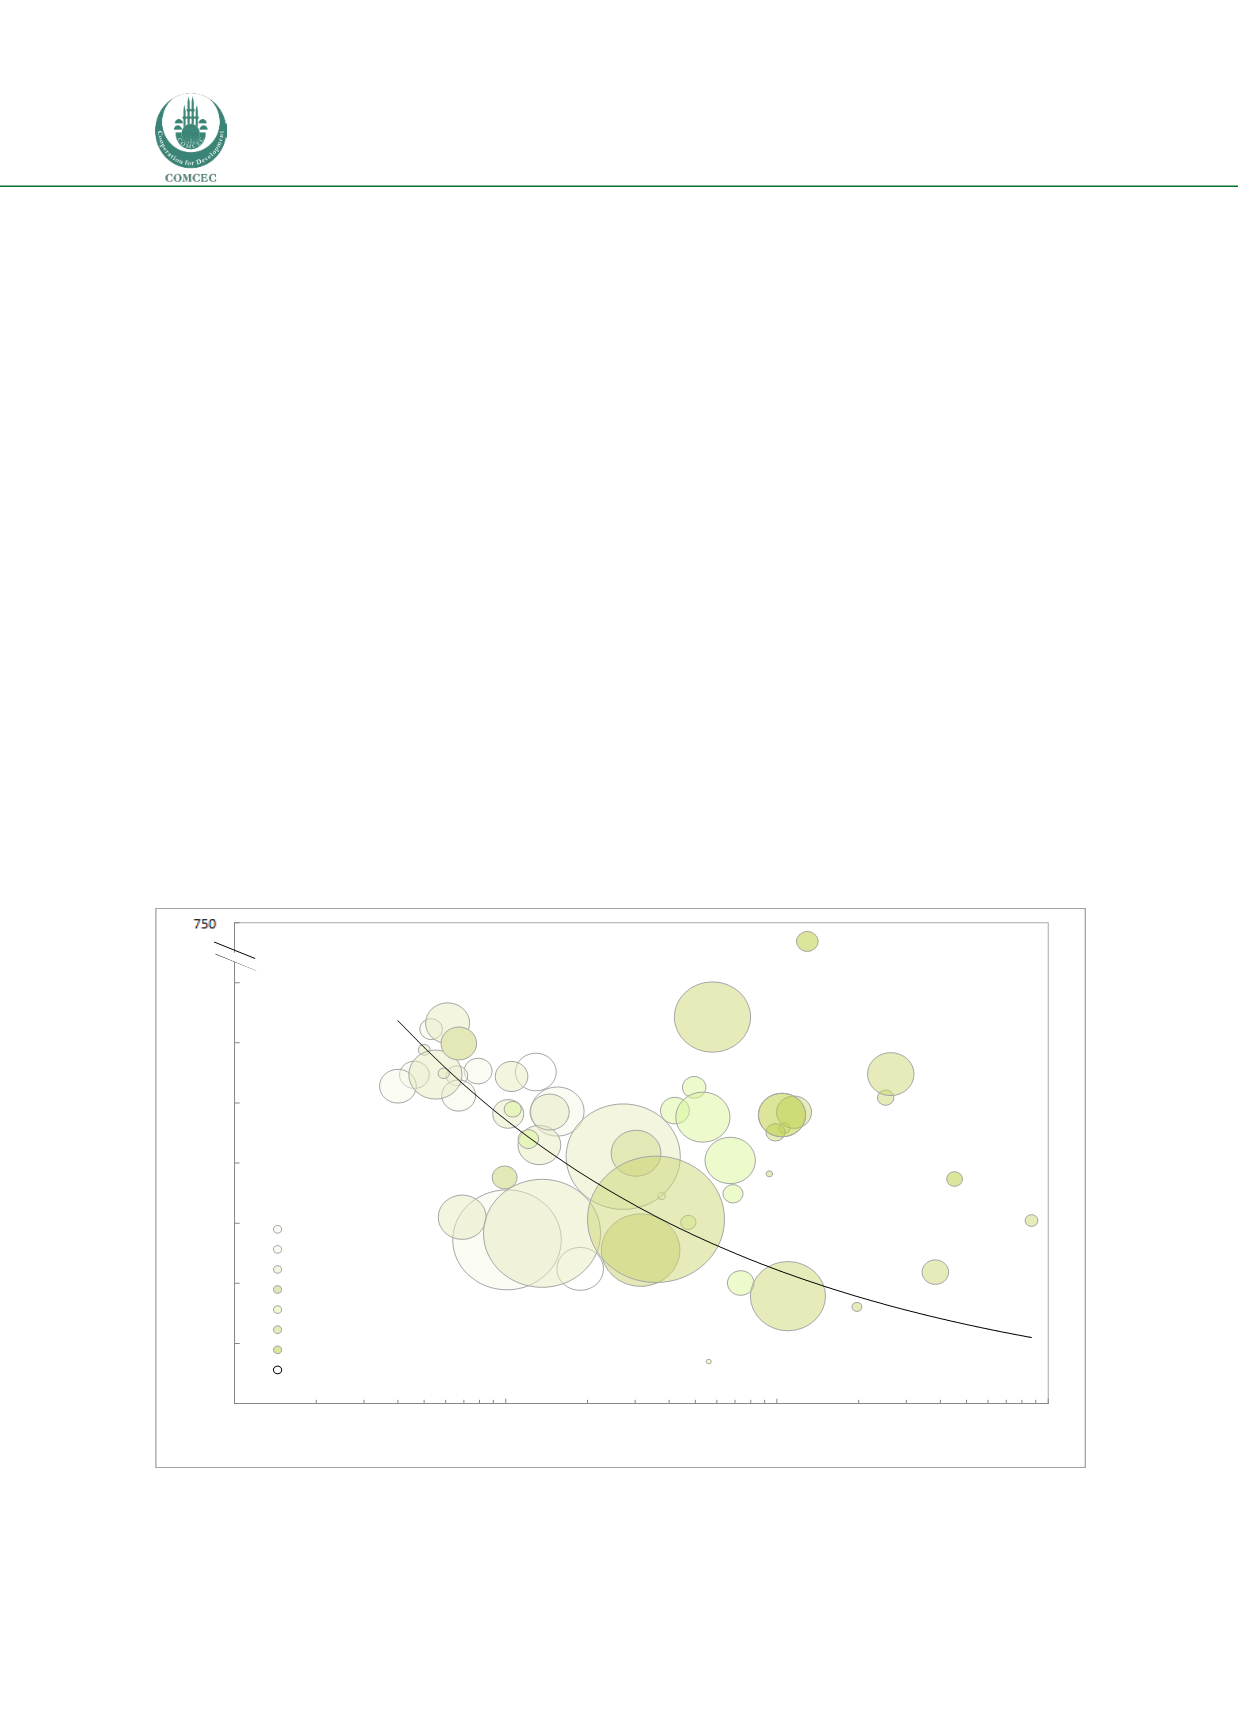
Figure 12shows the distribution of the data of
the OIC member countries around this average. In order to provide insight into population size
and vehicle ownership, the data points in the graph are represented by circles, the area of which
describes the size of population of each country and the colour shade the level of vehicle
ownership (darker representing higher ownership). It should be noted that vehicle ownership
is also based on WHO data and these include motorised two-wheelers.
Figure 12: Mortality versus pcGNI for OIC member countries
Source: WHO, 2015
Note: The line represents an unweighted best fit of a power function to the data as shown in Figure 5.1. To make
the results easier to observe, the horizontal axis is represented on a logarithmic scale.
MRT
AFG
ALB
ARE
AZE
BEN
BFA
BGD
BHR
CIV
CMR
DJI
DZA
EGY
GAB
GIN
GMB
GNB
GUY
IDN
IRN
IRQ
JOR
KAZ
KGZ
KWT
LBN
LBY
MAR
MDV
MLI
MOZ
MYS
NER
NGA
OMN
PAK
QAT
SAU
SDN
SEN
SLE
SUR
TCD
TGO
TJK
TKM
TUN
TUR
U A
UZB
YEM
0
50
100
150
200
250
300
350
400
100
1000
10000
100000
mortality [road deaths per million]
pcGNI [US$/capita]
<10
10-20
20-50
50-100
100-200
200-500
>500
unknown


