
Improving Road Safety
in the OIC Member States
68
A next group is formed by most of the remaining low income countries, that almost all have a
high road mortality. For these countries, road mortality is not notably higher than the average
for all countries. Notwithstanding this, their mortality is high and this may offer opportunities
to improve safety.
6.3.3
Fatality rates by vehicle population, income level and population in OIC member
countries
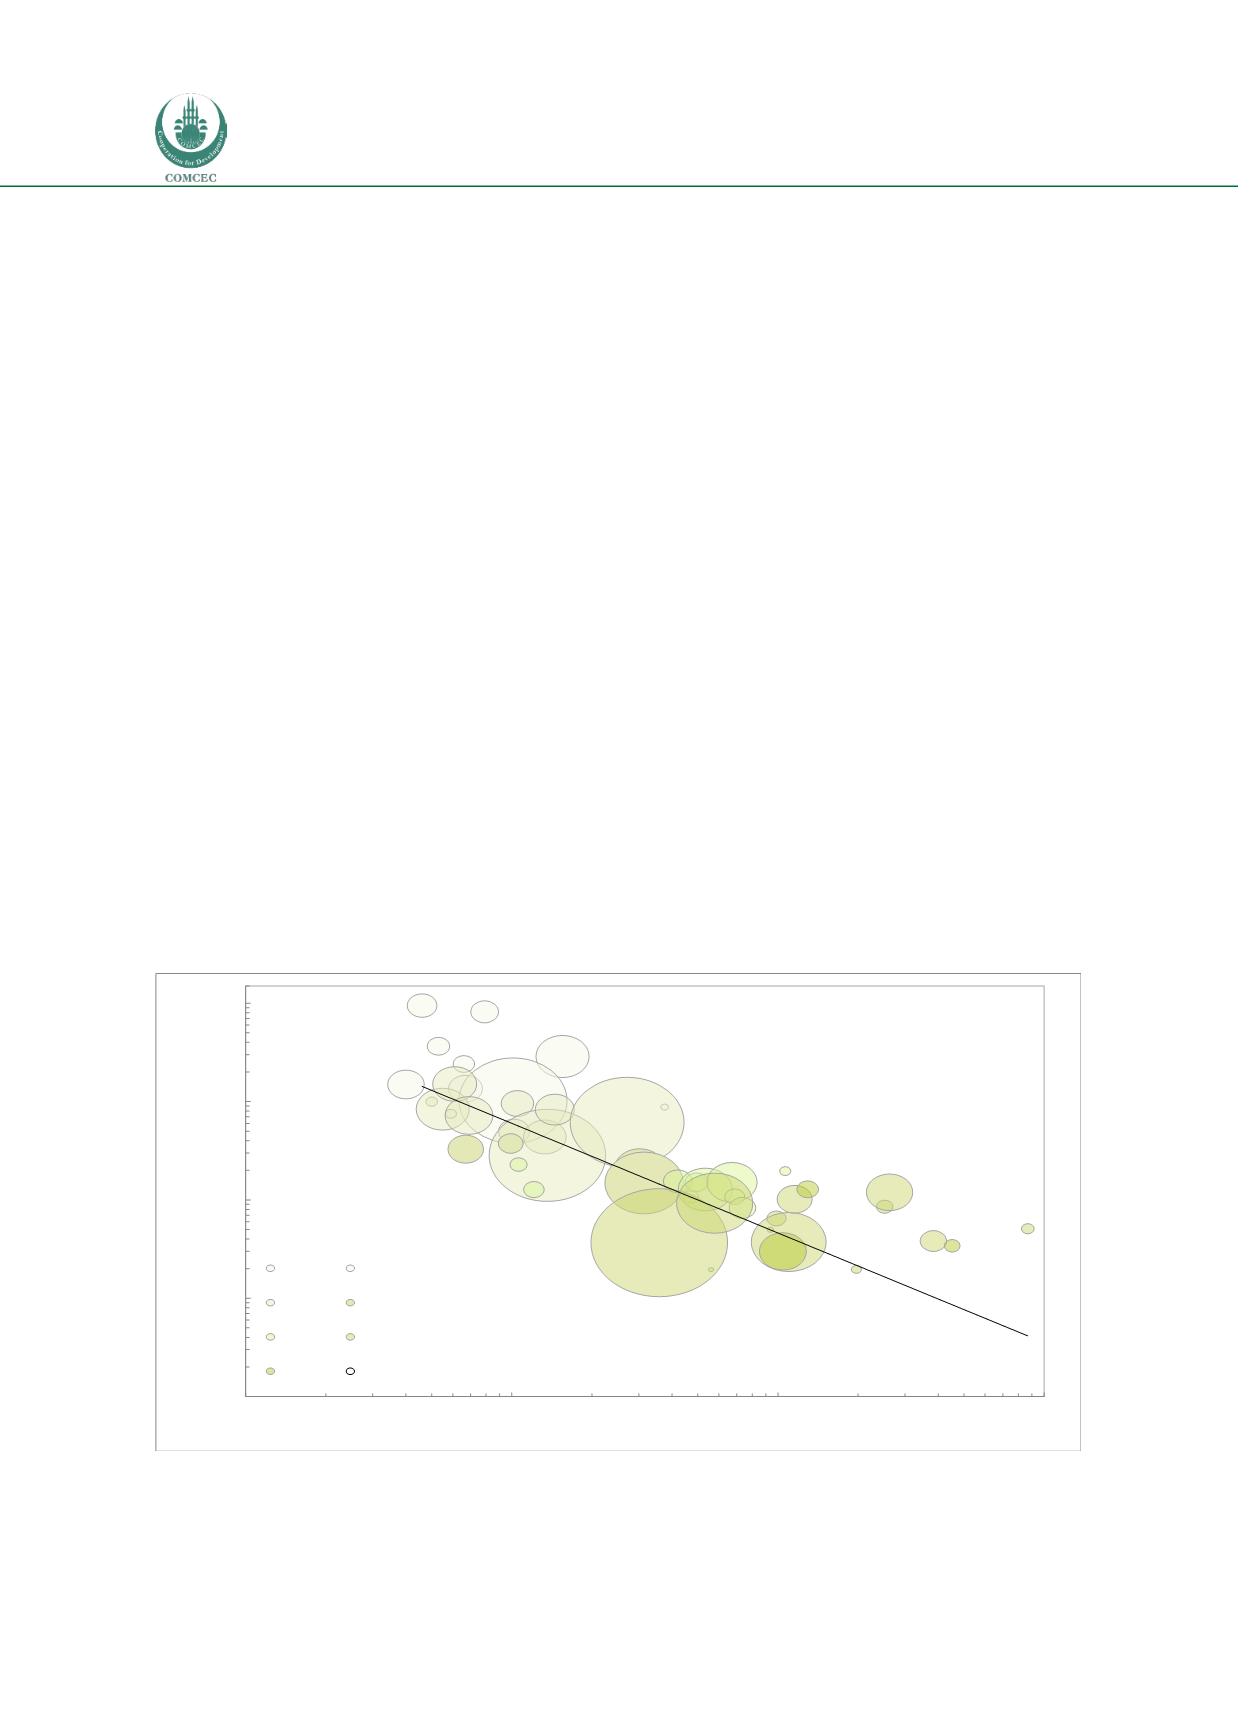
Figure 13 shows the relationship between road deaths as a function of the vehicle population to
income levels, vehicle ownership and population. The line in the graph represents the trend in
the average number of road deaths per 1,000 registered vehicles in 150 countries available in
the WHO report. The graph shows that, again, five out of six high income OIC member countries
have a moderately to highly enhanced risk as compared to this average, whereas most other
countries show a more or less equivalent number of road deaths per vehicle as compared to the
average.
From left to right the pcGNI increases, and from the colours used to represent fleet density
(vehicles per thousand inhabitants) we see that, not surprisingly, this fleet density also increases
with pcGNI. From this graph, the high mortality as shown i
n Figure 13for Libya and Iran can be
understood from the high fleet density (shown as a darker colour green).
Countries to the upper left of the graph show a very high number of road fatalities per vehicle,
indicating a very poor road safety level in general. Especially countries appearing above the
average line can be expected to have extremely unsafe roads.
Figure 13: Road deaths per 1,000 registered vehicles for Islamic countries
Note: The line represents the average for all countries with data available. It is a power law, with y = x-1.115.
Colours correspond to intervals of vehicles per 1000 inhabitants. The size of each circle is proportional to the
population of each country. For both axes, a logarithmic scale is used because of the large spread in values for both
pcGNI and road deaths per vehicle.
MRT
AFG
ALB
ARE
AZE
BEN
BFA
BGD
BHR
CIV
DZA
EGY
GAB
GIN
GMB
GNB
GUY
IDN
IRN
IRQ
JOR
KAZ
KGZ
KWT
LBN
LBY
MAR
MDV
MLI
MOZ
MYS
NER
NGA
OMN
PAK
QAT
SAU
SDN
SEN
SLE
SUR
TCD
TGO
TJK
TKM
TUN
TUR
UGA
YEM
0.01
0.1
1
10
100
100
1000
10000
100000
road deaths per thouand vehicles]
pcGNI [US$/capita]
<10
10-20
20-50
50-100
100-200 200-500
>500
unknown


