
Improving Road Safety
in the OIC Member States
65
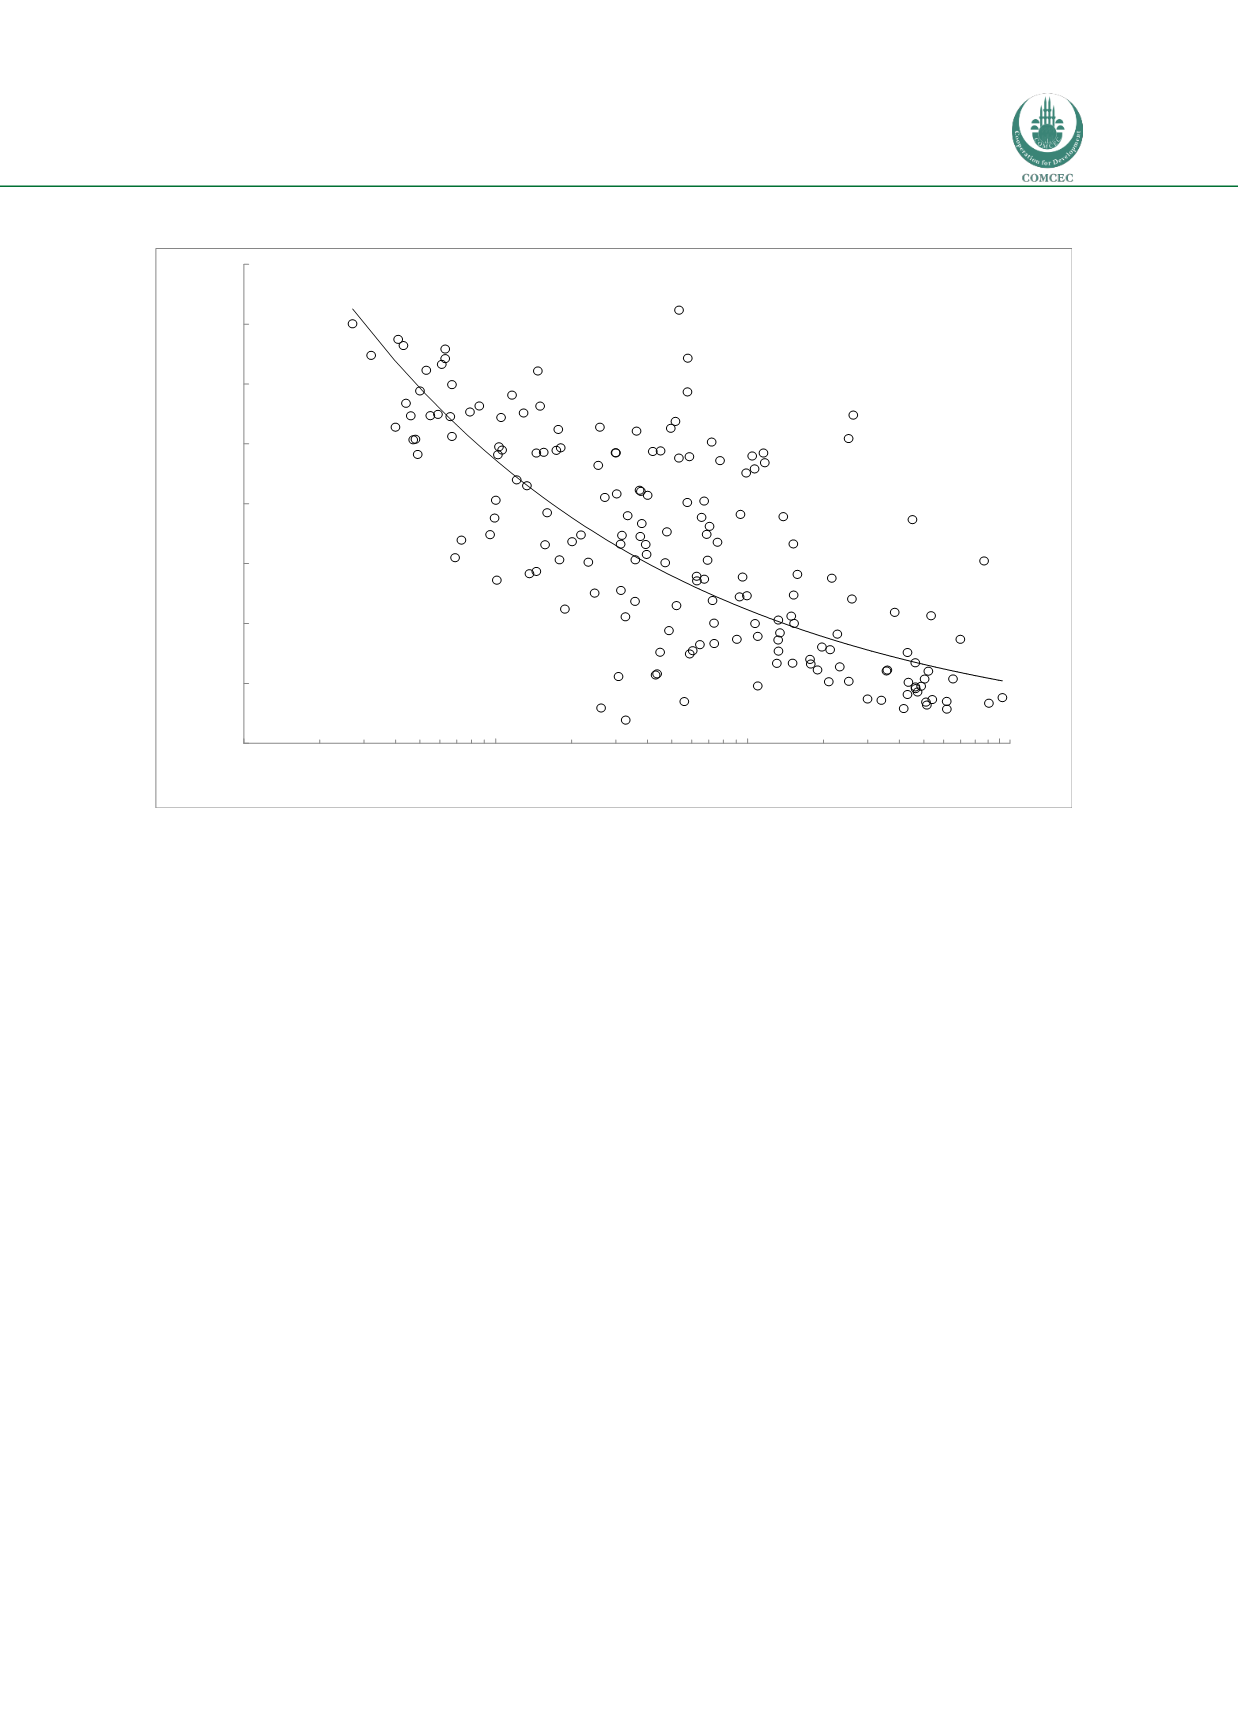
Figure 11: Mortality versus pcGNI for 180 countries
Source: WHO (2015)
Note: The line represents an unweighted best fit of a power function; its formula is mortality = 2259 (pcGNI) -0.327.
To make the results easier to observe, the horizontal axis is represented on a logarithmic scale.
The global relation between pcGNI and mortality as shown in
Figure 11 suggests that high
income correlates with high road safety levels. This seems logical, since high income is generally
indicative of a well-developed public transport system, high car ownership (as opposed to
powered two wheeler use) and long term investments in safe infrastructure, such as safe
highways.
The fitted regression line drawn in
Figure 11merely serves to indicate a general trend in the
data. Individual values for each country were not weighted by population to estimate this line
and each data point in the graph weighs equally. The large spread above and below this line
shows that, although high income helps to achieve better road safety, countries with roughly the
same income levels can still differ in mortality by a factor of three or more. There could be
various explanations for these differences, the most obvious being differences in traffic volumes
and distances travelled by vehicles and/or passengers. Other examples of factors which could
explain these differences could be geological differences (i.e. flat countries versus mountainous
countries) or weather conditions (e.g. long wet seasons) or differences in road user behaviour.
A low mortality in low income countries may indicate a low level of motorisation. This could
imply that increased levels of motorisation (vehicle ownership) may lead to increasedmortality.
Given the scope of this study, these factors cannot be investigated in detail. However, it is worth
mentioning one factor that could possibly explain differences in road safety rates (or, for that
0
50
100
150
200
250
300
350
400
100
1 000
10 000
100 000
Mortality [road deathts per million]
pcGNI [US$/capita]


