
Improving Road Safety
in the OIC Member States
61
6.1.2
Key characteristics of OIC member countries per region
Table 13t
o Table 15provide some general transport and related statistics for countries in each
of the three OIC regions; i.e. the African, Arab and Asian region.
African Region
For the African region these statistics reveal that vehicle ownership rates in OIC countries is
generally very low (below 50 vehicles/1,000 population) whereas the traffic mortality rates
(number of fatalities per 100,000 population) is relatively high (around 25 traffic
deaths/100,000 population) when compared to for example western countries. Developed
(mostly high income) western countries typically have vehicle ownership rates above 500
vehicles/1,000 population and traffic mortality rates below 10 deaths/100,000 population
(many countries with rates in the region of 3-6 per 100,000). However, the car ownership and
mortality rates of OIC countries in Africa do not appear to differ markedly from non-OIC
countries on the continent. The average vehicle ownership of OIC countries is 33 per 1000
population whereas the average for all countries on the continent is 25 per 1000 (World Bank,
2013; 2014). However, given the low vehicle ownership rates, mortality values are high and
suggest that many traffic victims are vulnerable road users (including moped riders and
cyclists). All OIC countries in the African region fall into the low to middle income categories,
which could explain the relatively low vehicle ownership rates.
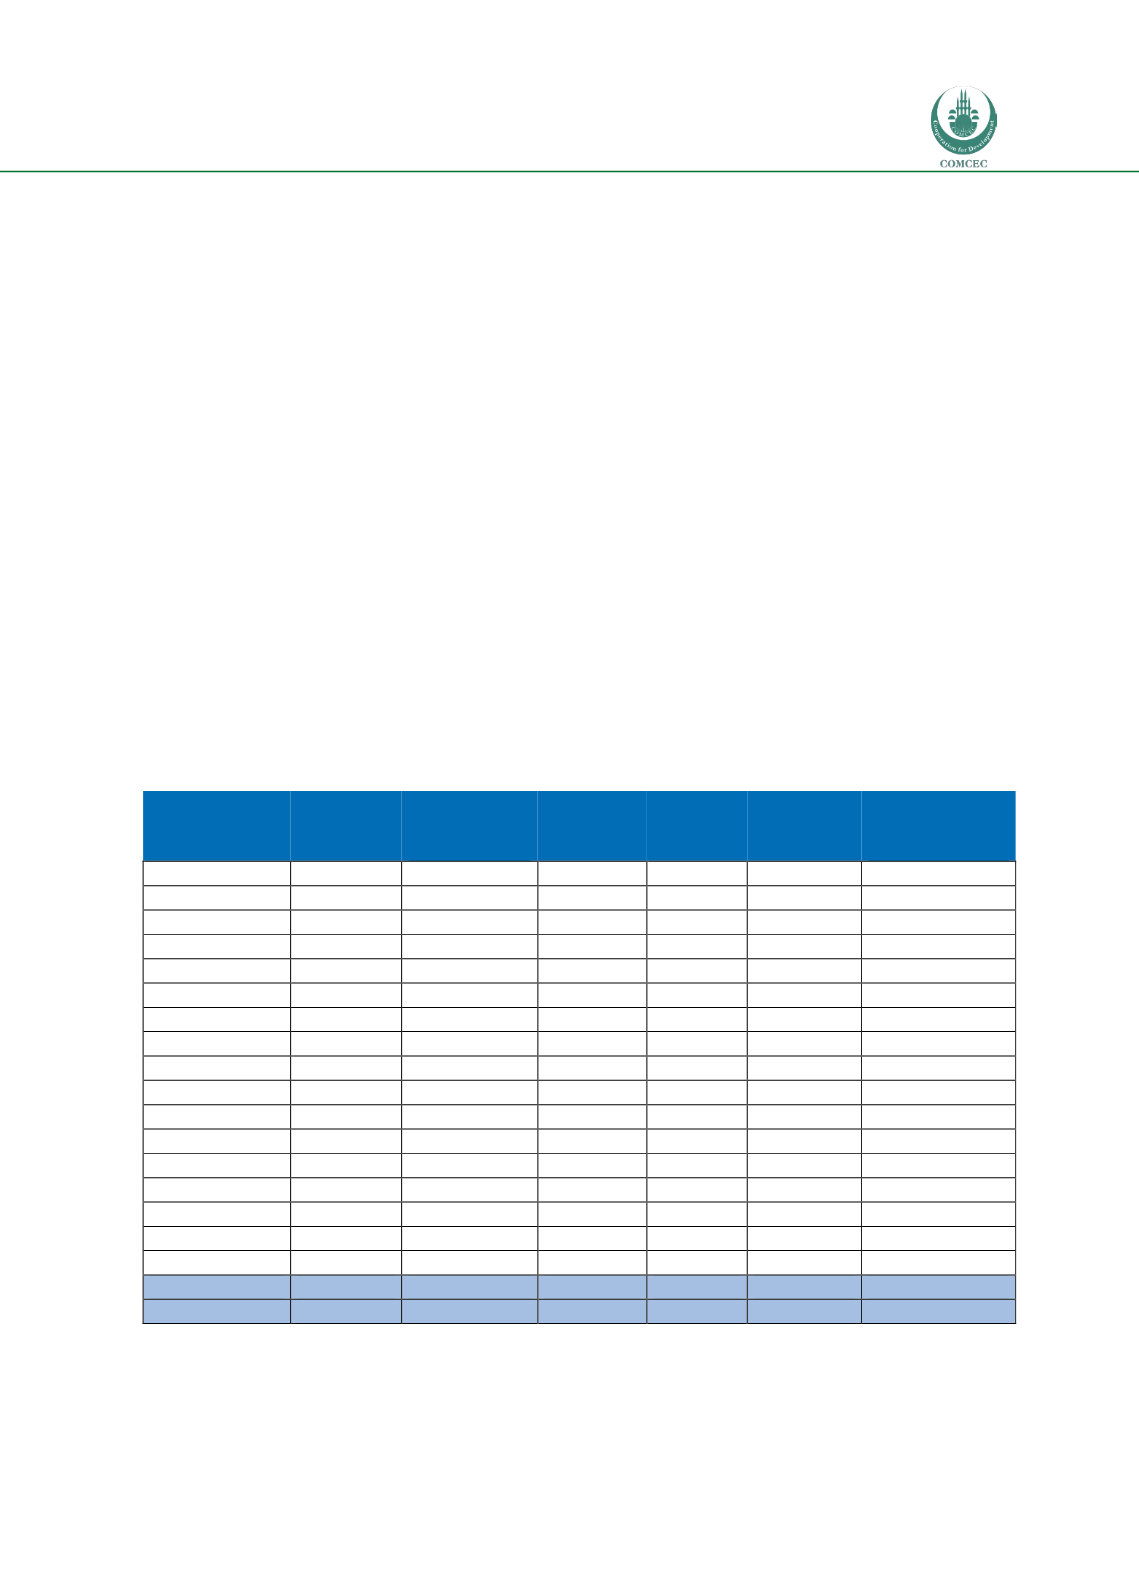
Table 13: Key statistics of OIC countries in the African region
Country
Population
[million]
Vehicle
ownership
(v./1,000 p.)
pcGNI
[US$]
Income
group
Estimated
road deaths
Mortality rate
[deaths/100,000
population]
Niger
17.8
18
400
Low
4,706
26.4
Guinea
11.7
3
460
Low
3,211
27.3
Gambia
1.8
29
500
Low
544
29.4
Togo
6.8
9
530
Low
2,123
31.1
Uganda
37.6
33
550
Low
10,280
27.4
Guinea-Bissau
1.7
37
590
Low
468
27.5
Mozambique
25.8
21
610
Low
8,173
31.7
Sierra Leone
6.1
11
660
Low
1,661
27.2
Burkina Faso
16.9
91
670
Low
5,072
30.0
Mali
15.3
19
670
Low
3,920
25.6
Benin
10.3
3
790
Low
2,855
27.7
Chad
12.8
49
1,020
Low
3,089
24.1
Senegal
14.1
28
1,050
Middle
3,844
27.2
Cameroon
22.3
1,290
Middle
6,136
27.6
Ivory Coast
20.3
29
1,450
Middle
4,924
24.2
Nigeria
173.6
33
2,710
Middle
35,641
20.5
Gabon
1.7
117
10,650
Middle
383
22.9
Total
396,6
97,030
Weighted Avg.
30
1,598.64
24. 5
Source: WHO (WHO, 2015b)
Note: Weighted averages based on population data


