


 185 / 214

Improving Transnational Transport Corridors
In the OIC Member Countries: Concepts and Cases
171
Of the five Mashreq North-South Corridor countries, only Jordan is a member of the World
Trade Organization (WTO). However, several countries in the Mashreq participate in bilateral
and regional integration agreements or in sub regional economic blocs.
As a result of a comprehensive discussion over two consecutive sessions of the
intergovernmental meeting of the ESCWA Committee on Transport, a manual for the
establishment of national transport and trade facilitation committees (NTTFCs) was adopted
at its fourth session, held in Beirut on 14-16 January 2003, with the aim of assisting countries
to establish such committees. Ten member countries established NTTFCs between 2003-2012,
namely, Egypt, Iraq, Jordan, Lebanon, Oman, Palestine, Saudi Arabia, the Sudan, the Syrian
Arab Republic, and Yemen.
Trade Volumes
Most of the Mashreq North-South Corridor region’s external trade involves three distinct
markets, Europe, the Persian Gulf, and Asia. Each presents a unique challenge not only because
of their geographic location but also because of the limited transport mode choices available.
All three markets can be served by airfreight, but at considerable cost. In addition, Asia is
served by maritime routes, the Gulf primarily by road, and Europe by road and sea.
As shown in
Table 24,intra trade on this corridor is only 6.3% of the total trade. There is no
evidence that this will be increasing, mainly due to the fact that each country has access to its
own port.
The LPI of the corridor countries is showing a slight negative trend in the last decade, as
shown in
Figure 64.In 2016, the average LPI of the corridor countries is 2.79, which is lower
than the world average 2.88. This means that the physical performance is undermined by lack
of harmonized systems and excessive NTBs.
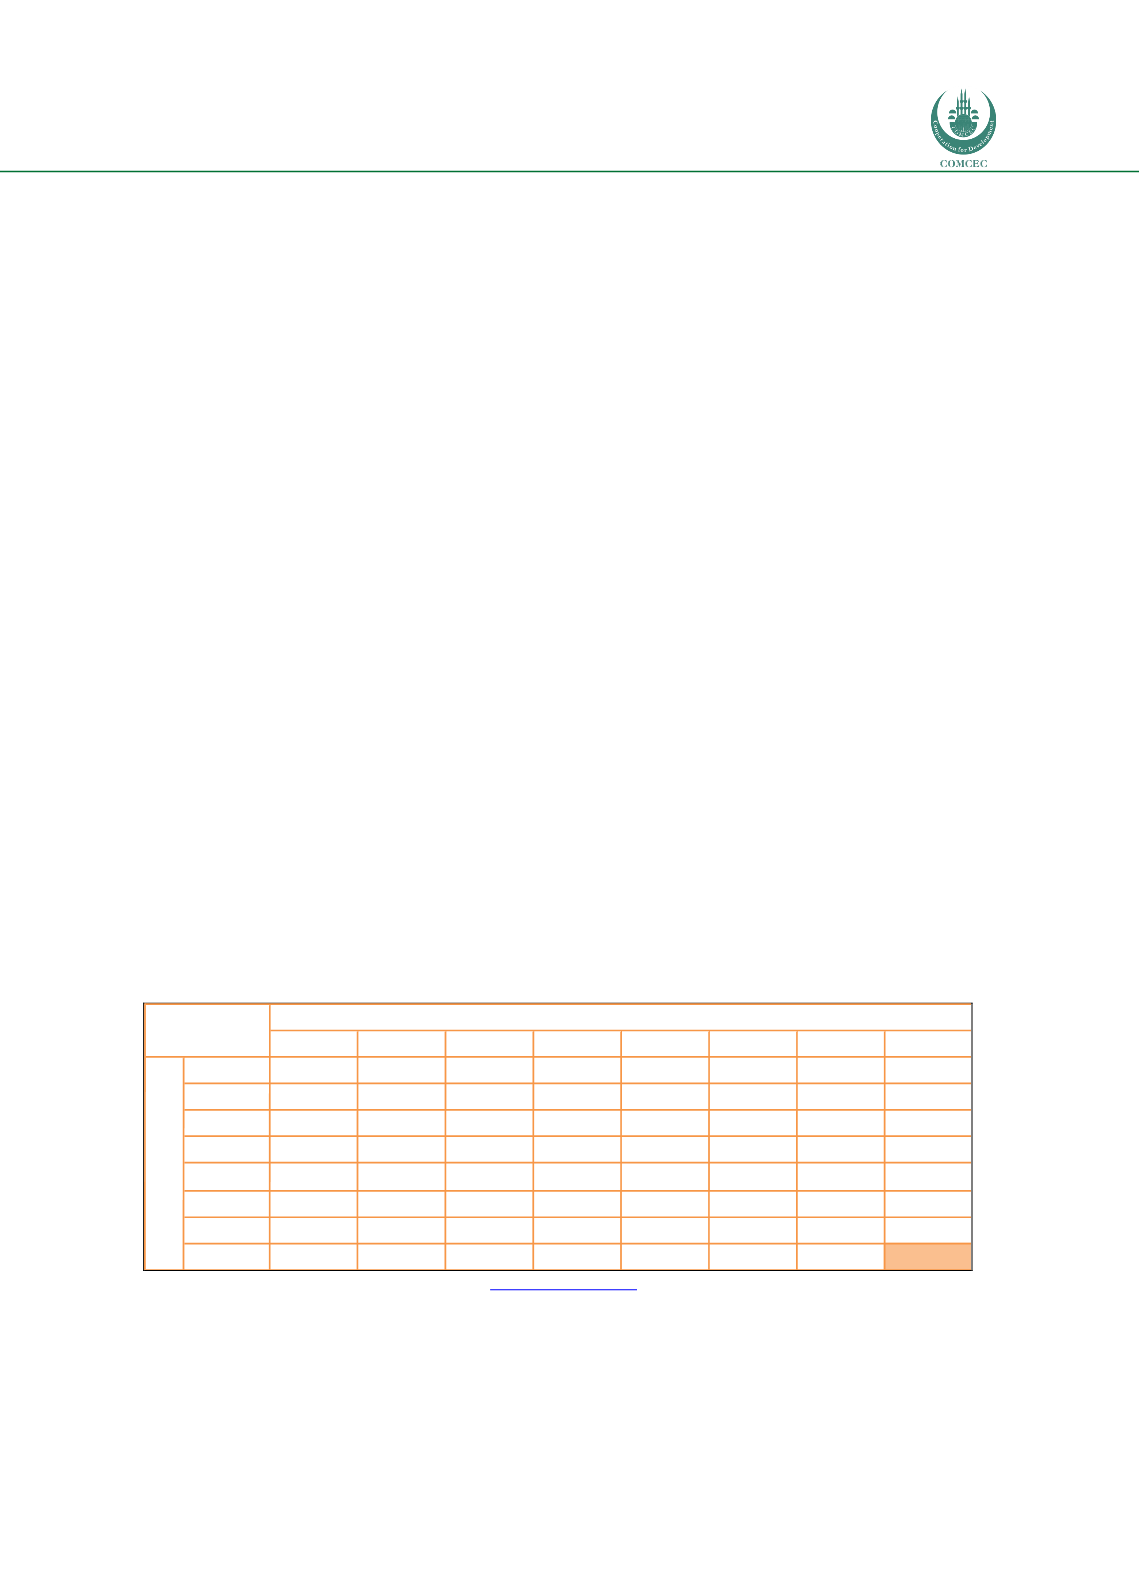
Table 64: Trade Matrix between corridor countries in 2015
Source: Fimotions (2017), analysis on data o
n www.trademap.org .JOR SAUDI
SYR TURKEY YEMEN Total
World
%
JOR
914.01
N/A 102.26 35.14
1,051 7,509 14.0%
SAUDI
2,325.50
N/A 1,835.23 563.63
4,724 207,572 2.3%
SYR
89.10 95.48
65.39 12.40
262
732 35.9%
TURKEY
664.76 2,905.08
N/A
452.53
4,022 142,606 2.8%
YEMEN
3.06 39.07
N/A 0.02
42
664
6.3%
Total
3,082 3,954
-
2,003 1,064 10102.7
World 19,207 129,796 4,304 198,602 6,424
359,083
%
16.0% 3.0% 0.0% 1.0% 16.6%
2.8%
COUNTRY
Imports (Million USD)
Exports (Million USD)