


 186 / 214

Improving Transnational Transport Corridors
In the OIC Member Countries: Concepts and Cases
172
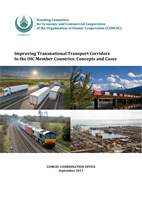
Figure 63: Intra trade on North-South Corridor
Source: Fimotions (2017), analysis on data o
n www.trademap.org .Note: the thickness of the line represents the trade volume
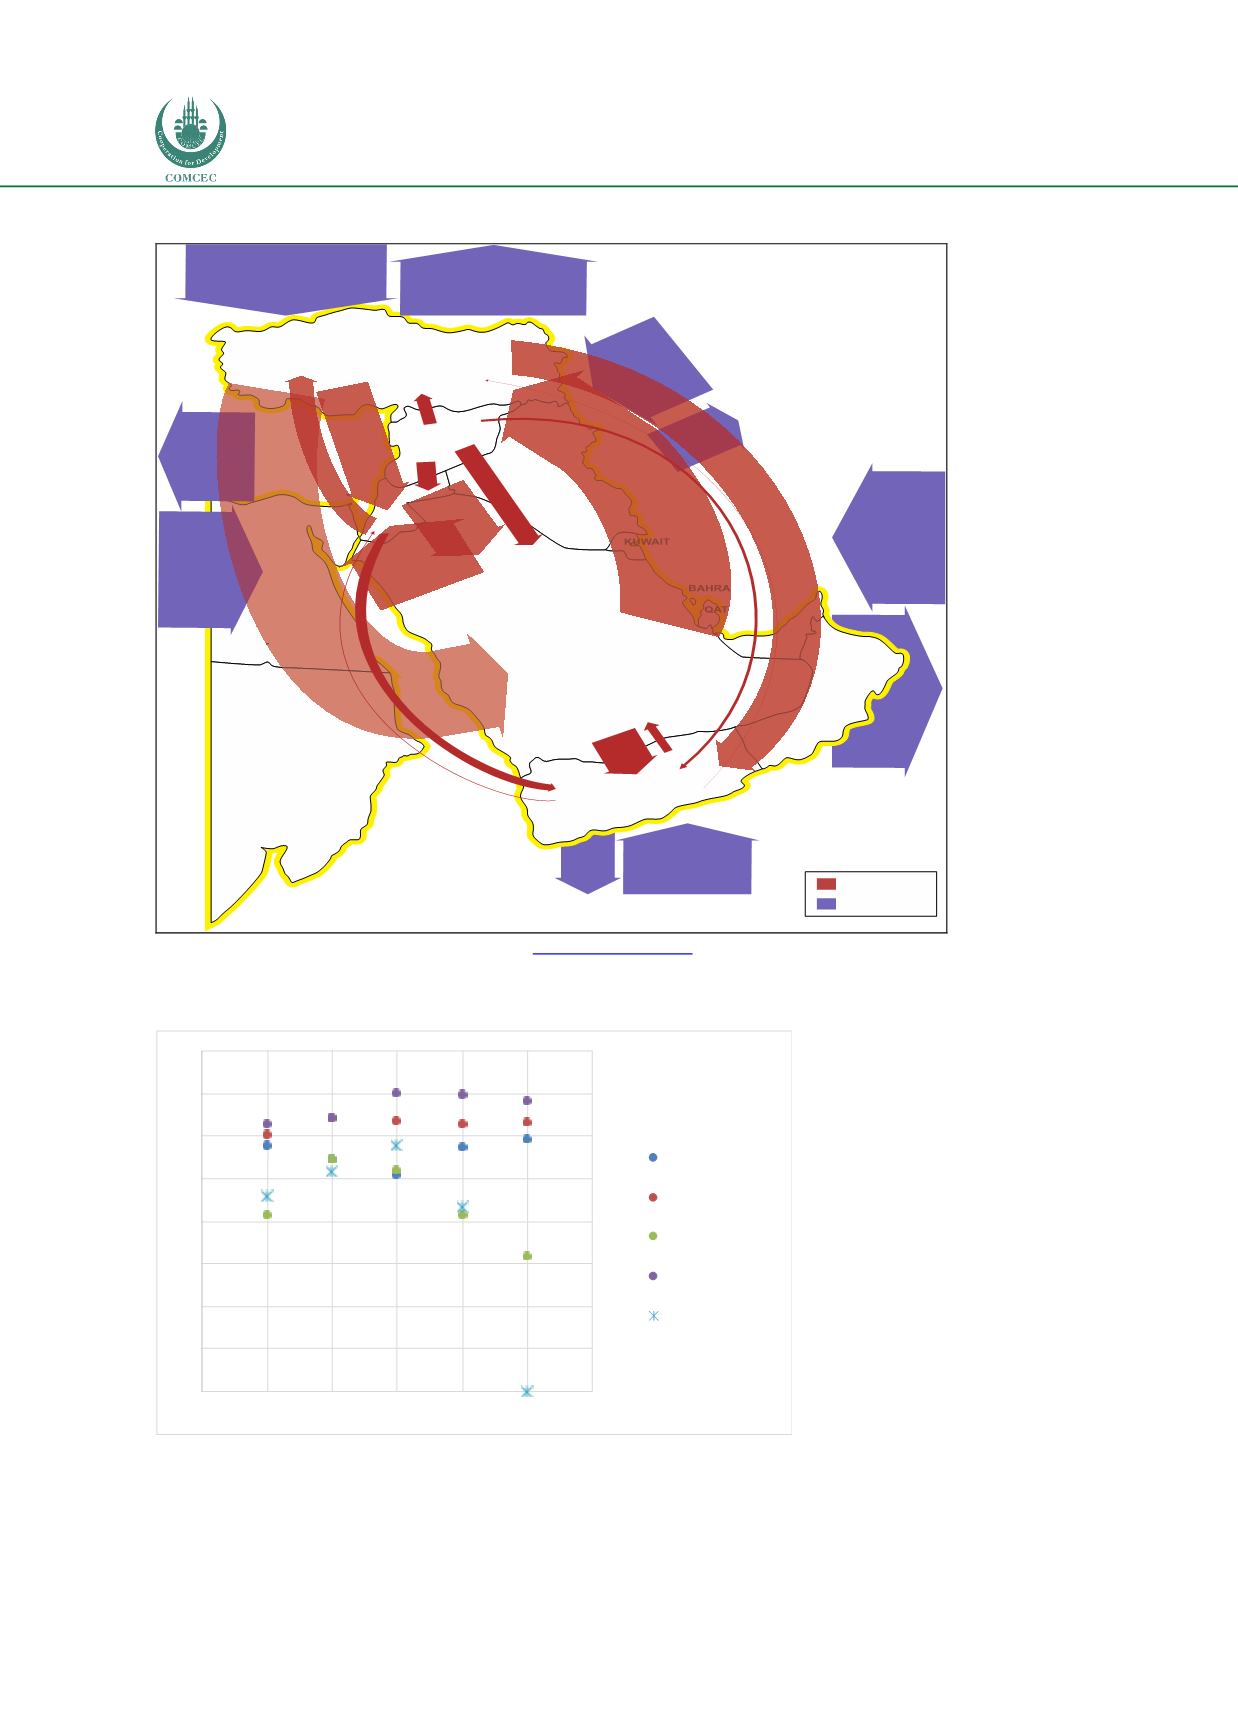
Figure 64: Logistics Performance
Index of corridor countries
Source: Fimotions (2017), data source: World Bank.
TURKEY
SYRIA
SAUDI
ARABIA
YEMEN
SUDAN
EGYPT
JORDAN
Intra trade
World trade
OMAN
KUWAIT
QATAR
BAHRAIN
U.A.E
IRAQ
0
0.5
1
1.5
2
2.5
3
3.5
4
2007 2010 2012 2014 2016
Jordan
Saudi Arabia
Syrian Arab
Republic
Turkey
Yemen