
Improving Transnational Transport Corridors
In the OIC Member Countries: Concepts and Cases
102
harmonization of regulations. Ideally, trade agreements should be maintained considering the
fact that the countries covered by this corridor are landlocked countries that have common
interests.
Trade Volumes
Among the countries on CAREC corridor 3, Kazakhstan has the highest trade flow in terms of
exports and imports. It is clearly due to its geographical position, which is pivotal for both
Europe-Asian transit and to the Central Asian countries.
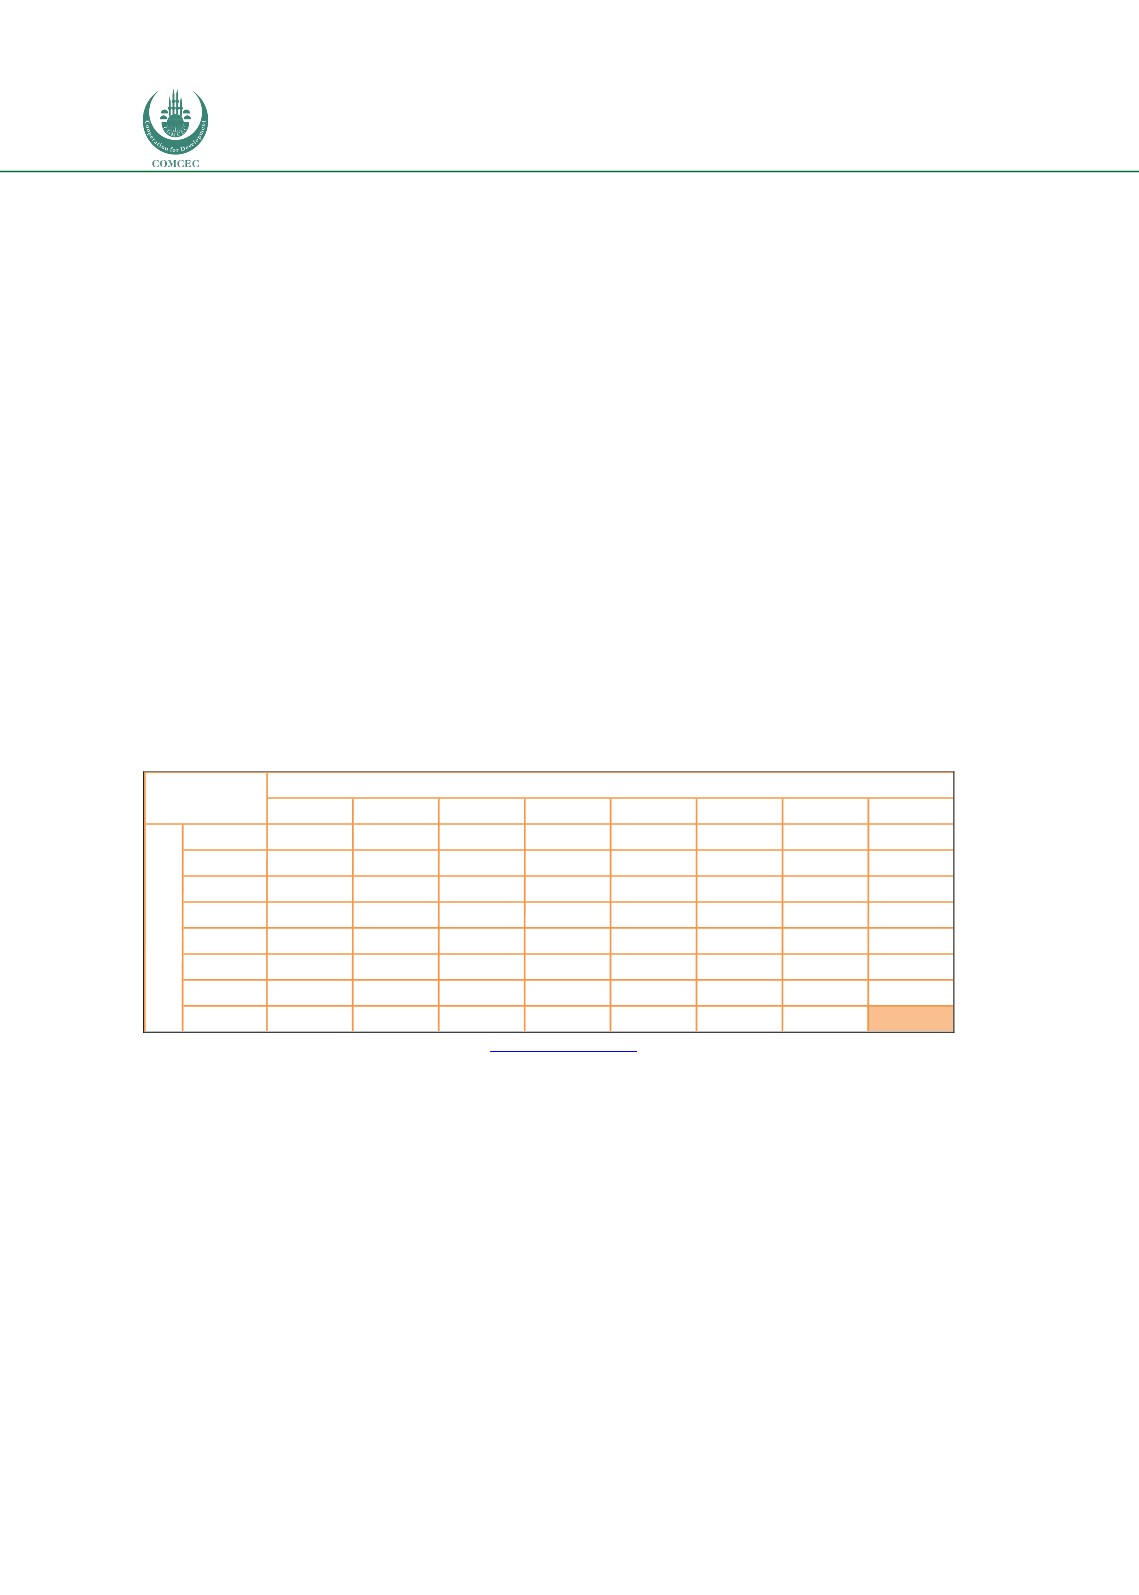
Table 24 an
d Figure 34show exports and imports data between countries on CAREC corridor
3. The highest trade flow can be seen between Kazakhstan - Uzbekistan, followed by
Kazakhstan - Kyrgyz Republic. This partly explains why corridor 3a is more active than
corridor 3b.
The analysis shows that intra trade on corridor 3 is only 8.2% of the trade with rest of the
world. Of the whole CAREC region, this number is only 3.7%. Ideally, there is substantial trade
between a landlocked country and its neighbors due to the absence of ports. Restrictive transit
between the corridor countries (see 3.3.2) might explain these figures. Tajikistan appears to be
trading more with the corridor countries than rest of the world.
Table 24: Trade Matrix CAREC 3 in 2015
Source: Fimotions (2017), analysis on data o
n www.trademap.org .Note: data between Tajikistan and Uzbekistan is dated in 2000.
AFG KAZ
KGZ
TAJ
UZB Total
World
%
AFG
10.85
N/A 4.70
0.26
16
421 3.8%
KAZ
486.89
376.13 371.89 922.53
2,157 36,775 5.9%
KGZ
8.19 151.15
21.84 125.07
306 1,423 21.5%
TAJ
91.53 218.42
6.43
N/A
316
673 47.0%
UZB
336.01 587.80 69.77
N/A
994 6,983 14.2%
Total
923
968
452
398 1,048 3,789
World
3,320 25,175 3,844 3,223 9,163
46,276
% 27.8% 3.8% 11.8% 12.4% 11.4%
8.2%
COUNTRY
Imports (Million USD)
Exports (Million USD)


