


 184 / 214

Improving Transnational Transport Corridors
In the OIC Member Countries: Concepts and Cases
170
4.8.3.
Economic factors
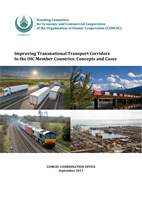
Based on EoDB compiled annually by the World Bank, Turkey performs best among the
corridor countries. However, if only Mashreq countries are considered, it is Jordan. As shown
in
Table 62,the times taken to complete border and documentary processes in Jordan are the
lowest, much lower than the other countries. Jordan appears to have very efficient customs
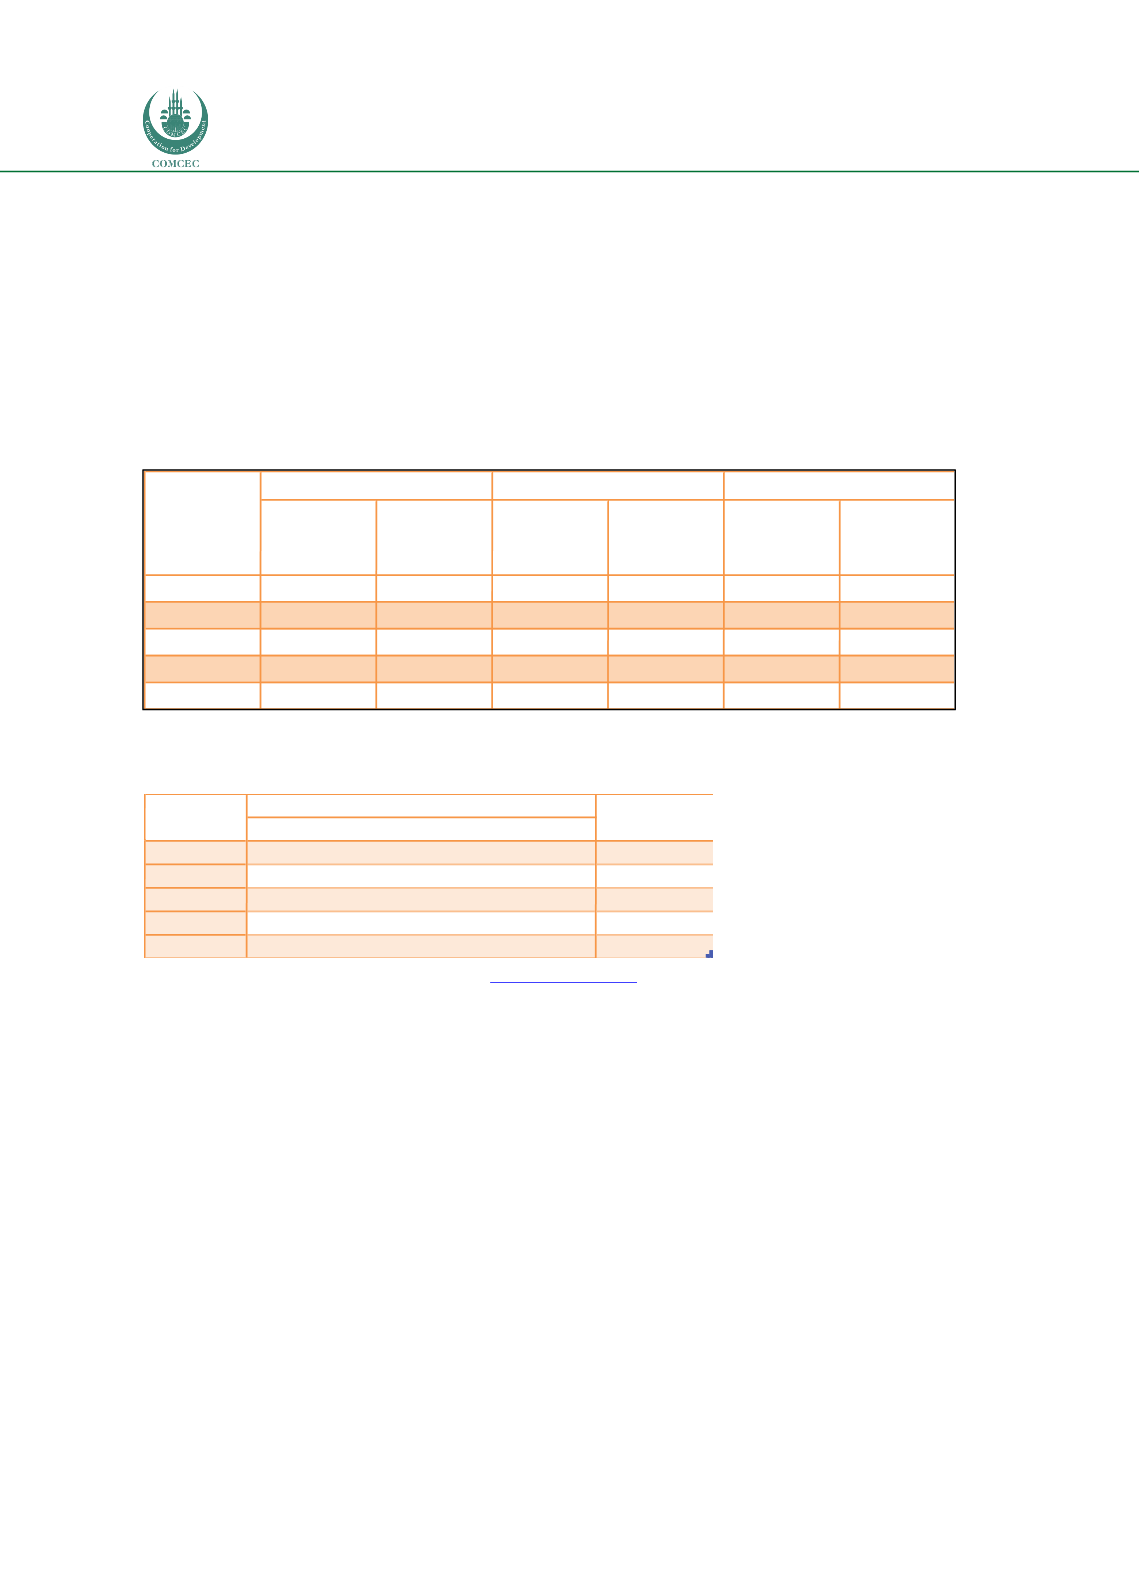
clearance procedures. The cost to export is also the least. This is also confirmed by its OI,
which is the highest among the corridor countries, as indicated in Table 63.
Table 62: EoDB of corridor countries in 2016
Source: World Bank
Table 63: Openness of corridor countries in 2016
Source: Fimotions (2017), analysis on data o
n www.trademap.org .4.8.4.
Trade Facilitation
Trade Agreements
Member States of the Economic and Social Commission for Western Asia (ESCWA) adopted the
Integrated Transport System in the Arab Mashreq North-South Corridor (ITSAM). ITSAM aims
to facilitate trade and transport between the countries of the region, in order to enhance
regional integration and trade flows. ITSAM includes the following: (a) an agreement on
international roads in the North-South Corridor; (b) priority routes M40 and M45; (c) an
agreement on international railways in the Mashreq North-South Corridor; (d) a memorandum
of understanding on maritime transport cooperation in the North-South Corridor; (e) national
committees for the facilitation of transport and trade; (f) road safety; (g) a regional transport
information system; and (h) an agreement on multimodal transport of goods between Arab
countries.
GDP
Imports
Exports
JOR
37,517
19,207
7,509
71.2%
SAUDI
646,002
129,796
207,572
52.2%
SYR
N/A
17,561
11,353
N/A
TURKEY
718,221
198,602
142,606
47.5%
YEMEN
35,955
6,753
509
20.2%
Country
USD Millions
Openness
TURKEY
69
70
16
376
5
87
SYR
173
176
84
1113
48
725
JORD
118
50
38
131
2
16
SAUDI
94
158
69
264
90
105
YEMEN
179
189
N/A
N/A
N/A
N/A
Time to
export
(hours)
Cost to
export
(USD)
Documentary Compliance
Overall
Trading
across
borders
Time to
export
(hours)
Country
Ranking
Border Compliance
Cost to
export
(USD)