


 25 / 205

Sustainable Destination Management
Strategies in the OIC Member Countries
13
on the overall performance of the corridor. Restrictive policies, such as cumbersome visa
requirements, diminish tourists’ willingness to visit a country, and indirectly reduce the
availability of crucial services. Components measured in international openness include the
openness of bilateral air service agreements which the government has entered, and which
impact the availability of air connections to the country, and the number of regional trade
agreements in force, which is a proxy for the extent to which it is possible to provide world-
class tourism services.
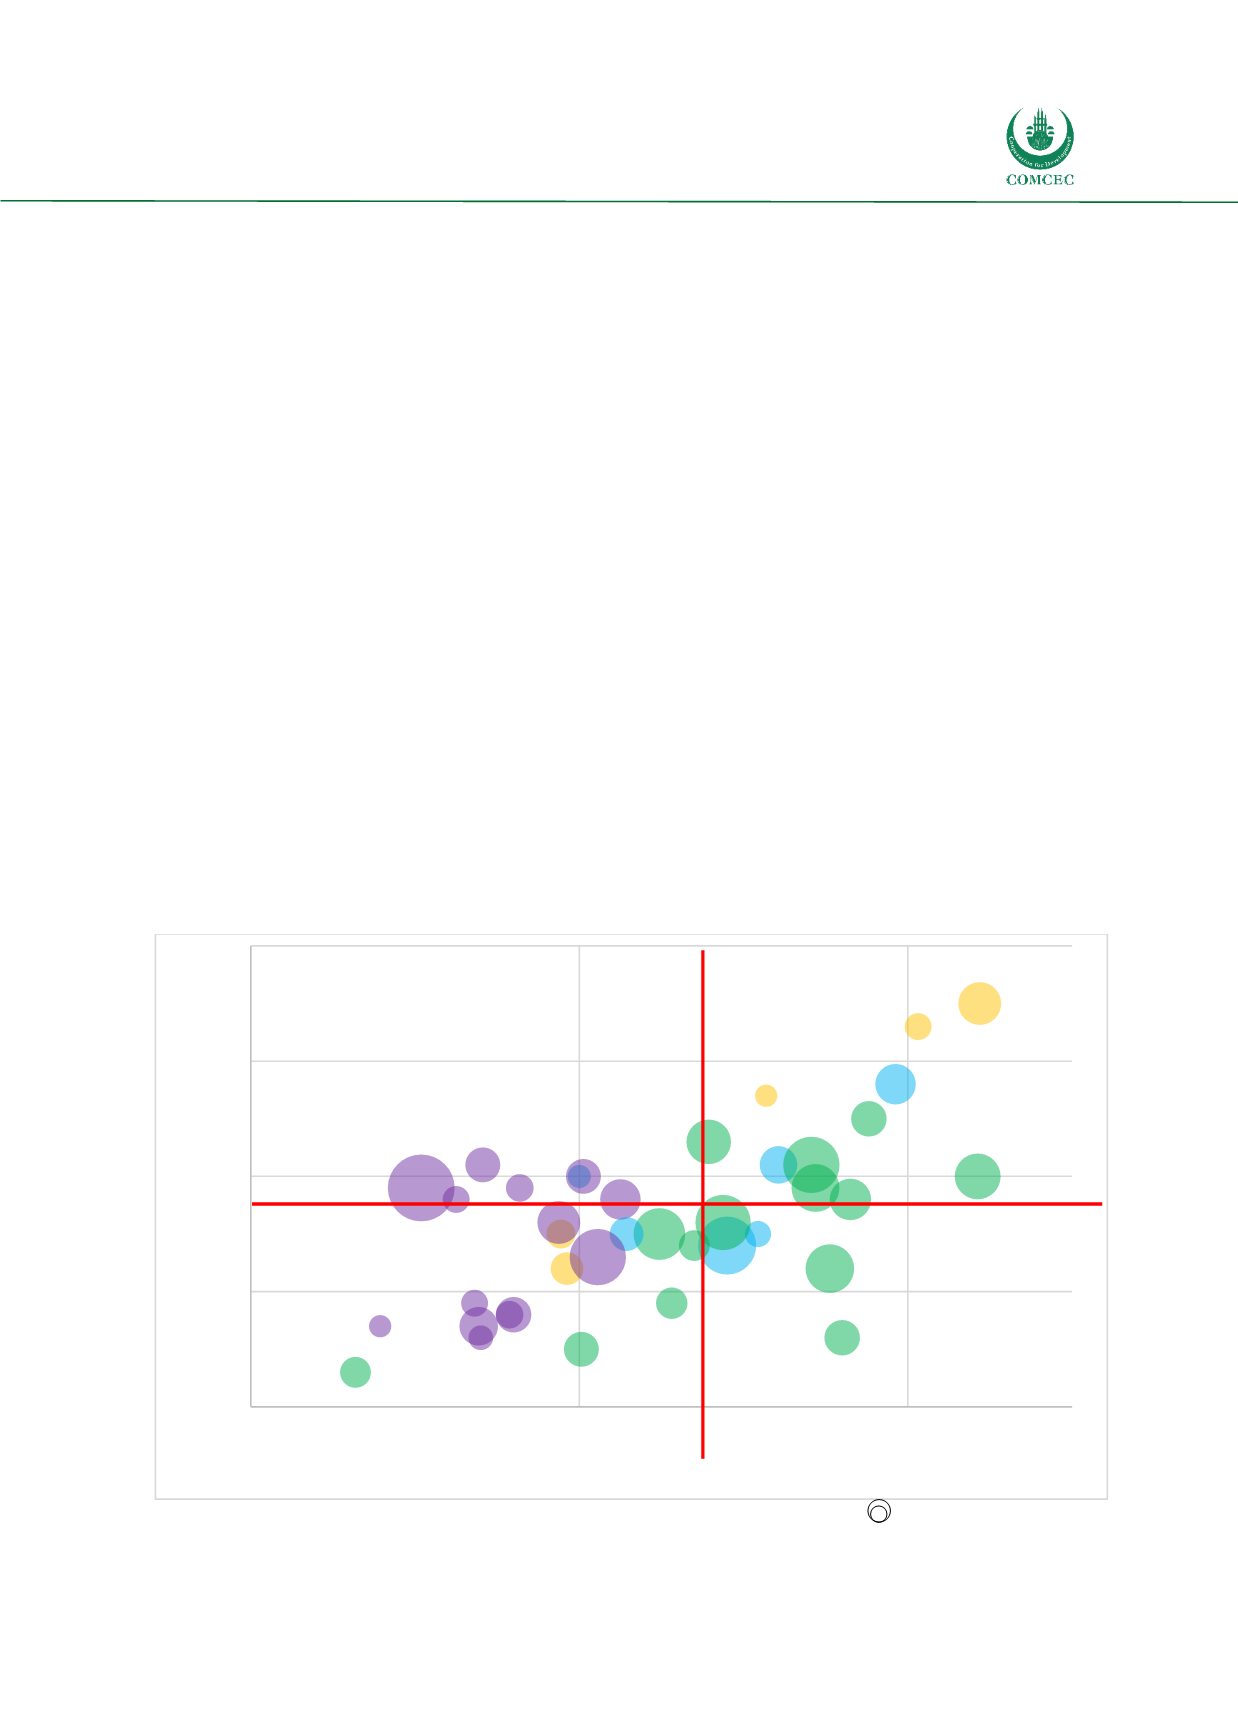
An additional component in this scatter graph is the share of tourism to the overall GDP. This
is indicated by the size of the circles per country. The higher the share of tourism to the GDP,
the higher the impact of tourism development on the country, or the lower the development in
other economic sectors in comparison with tourism. Generally, the higher the share of a sector
in the overall GDP, the more a government is inclined to focus on that sector. Dividing the
scatter graph into four quadrants shows four general groups of countries. Those that are in the
not tourism ready & closed group, which are mostly Sub-Saharan countries, require the most
development work in tourism. These countries are mostly emerging destinations, which did
not have the resources to develop their tourism industry or have just recently opened up to
international arrivals.
Countries in the not tourism ready & open quadrant are also mostly Sub-Saharan. Their
infrastructure and visa policy are already allowing easier travel for international tourism.
However, they need to develop the sector in terms of policies, capacity, and standards to cater
to more tourists and build a sustainable tourism industry. Countries that are closed but tourism
ready are generally those that offer a wide variety of attractions but, due to political reasons,
are closed to international visitors. Asian countries are the leaders in the ready and open
quadrant.
Figure 5: Segmentation Using the Indicators Tourism Readiness and International Openness
Source: DinarStandard Analysis
Albania
Algeria
Azerbaijan
Bahrain
Bangladesh
Benin
Brunei-Darussalam
Burkina-Faso
Cameroon
Chad
Cote D'Ivoire
Egypt
Guinea
Indonesia
Iran
Jordan
Kazakhstan
Kuwait
Kyrgyz Republic
Lebanon
Malaysia
Mali
Mauritania
Morocco
Mozambique
Nigeria
Oman
Pakistan
Qatar
Saudi Arabia
Senegal
Sierral Leone
Tajikistan
The Gambia
Tunisia
Turkey
Uganda
United Arab Emirates
Yemen
1
2
3
4
5
2,0
3,0
4,0
International Openness
Tourism Readiness
Tourism share of GDP
Tourism Ready & Open
Tourism Ready & Closed
Not Tourism Ready & Open
Not Tourism Ready & Closed