
Improving Customs Transit Systems
In the Islamic Countries
101
lowest performance has low-income countries, especially low-income MS, of the Asian group
(1.95).
Table 35: Cross-tabulation of LPI score with geographic distribution and level of economic
development of the OIC MS
Geographic distribution
African Group
Arab Group
Asian Group
LPI Score
LPI Score
LPI Score
Level of
economic
development
High income
3.24
2.71
Upper middle income
2.38
2.52
2.75
Lower middle income
2.66
2.48
2.69
Low income
2.38
2.37
1.95
Source: Authors’ own compilation
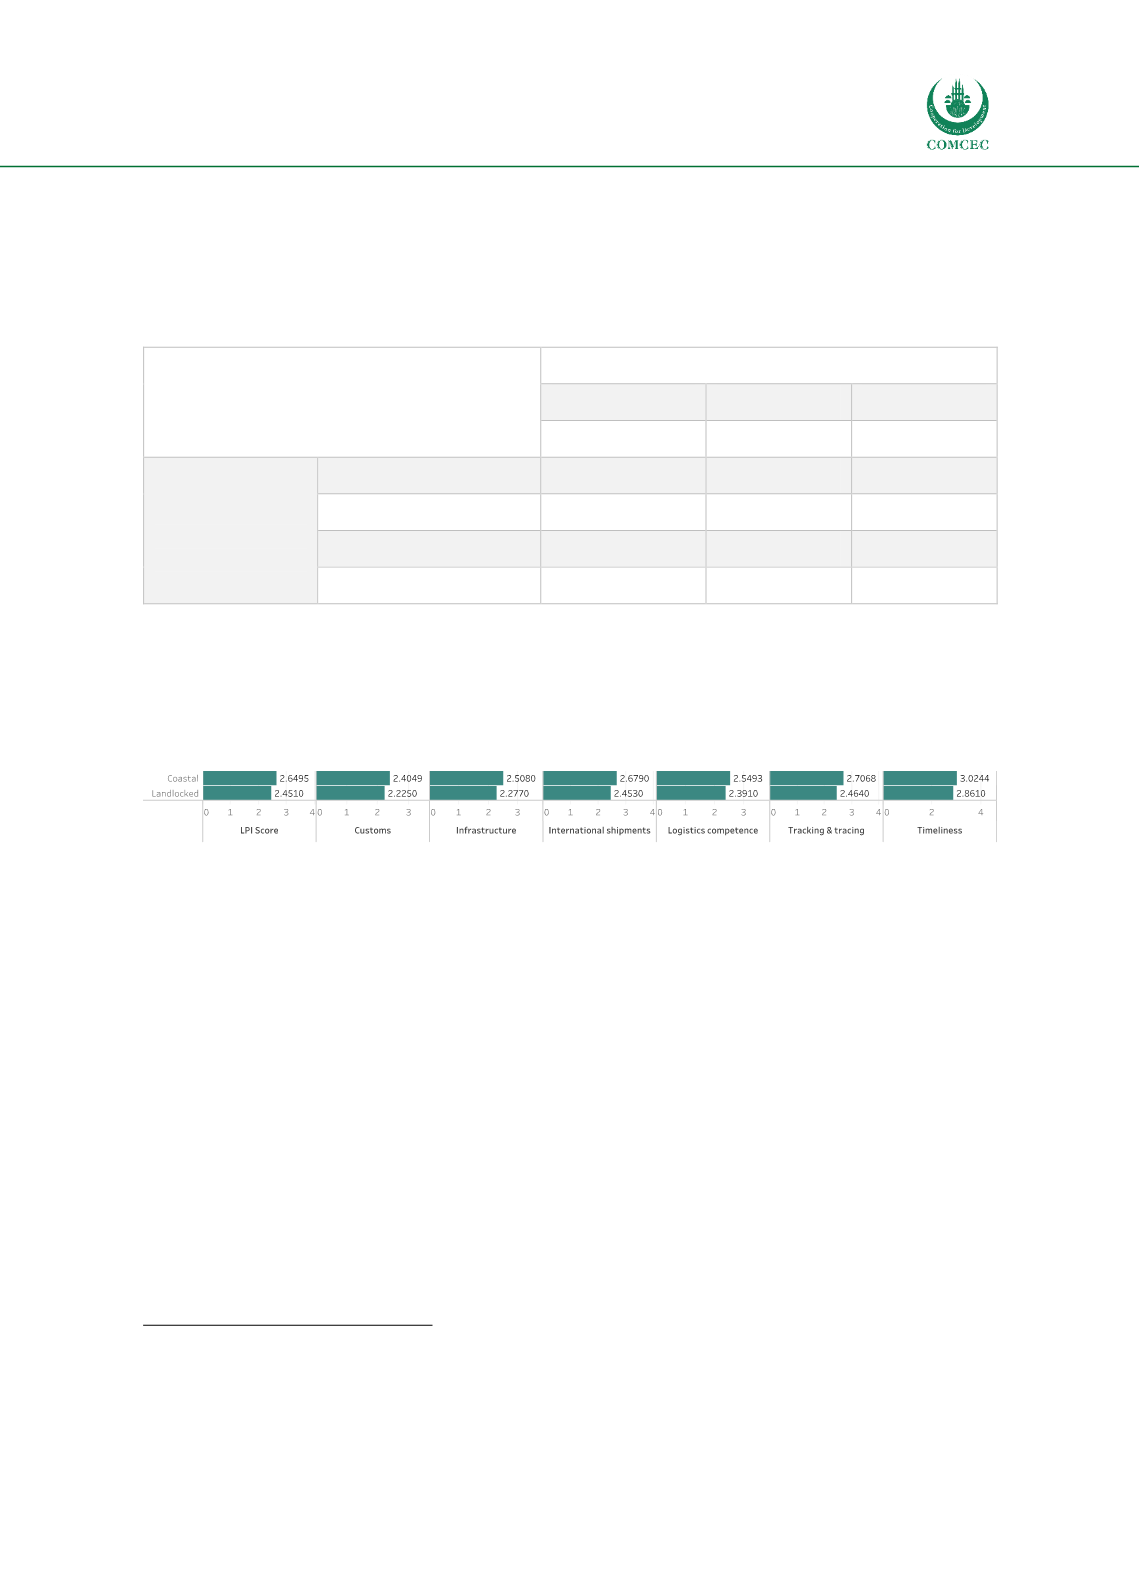
When comparing landlocked countries with maritime countries, according to overall LPI score
and with all six dimensions, better performance of maritime countries is evident
(Figure 21).
Figure 21: Landlocked and Maritime countries LPI Score
Source: WB LPI
3.2.4
UN Global Survey on Digital and Sustainable Trade Facilitation
The 2019 UN Global Survey on Digital and Sustainable Trade Facilitation conducted by the five
United Nations Regional commissions (UNRCs) use data from a survey of 128 economies from 8
regions. The main area with of the survey are: General Trade Facilitation regarding measures
fromWTO Trade Facilitation Agreement (TFA), Digital Trade Facilitation for implementation of
innovative, technology-driven measures for exchange of electronic trade data and documents,
sustainable trade facilitation with focus to trade facilitation for SMEs, agricultural sector and
women in trade, and Trade Finance.
Average trade facilitation score of 36 OIC MS (out of 30 economies assessed in 2017) according
to the UN Global Survey on Digital and Sustainable Trade Facilitation
78
is 55.77%, , lower than
the global average of 62.67% and an average of the developed economies with 80% trade
7
8 https://www.unece.org/tradewelcome/outreach-and-support-for-trade-facilitation/global-survey-on-digital-and-sustainable-trade-facilitation.html


