
Improving Customs Transit Systems
In the Islamic Countries
100
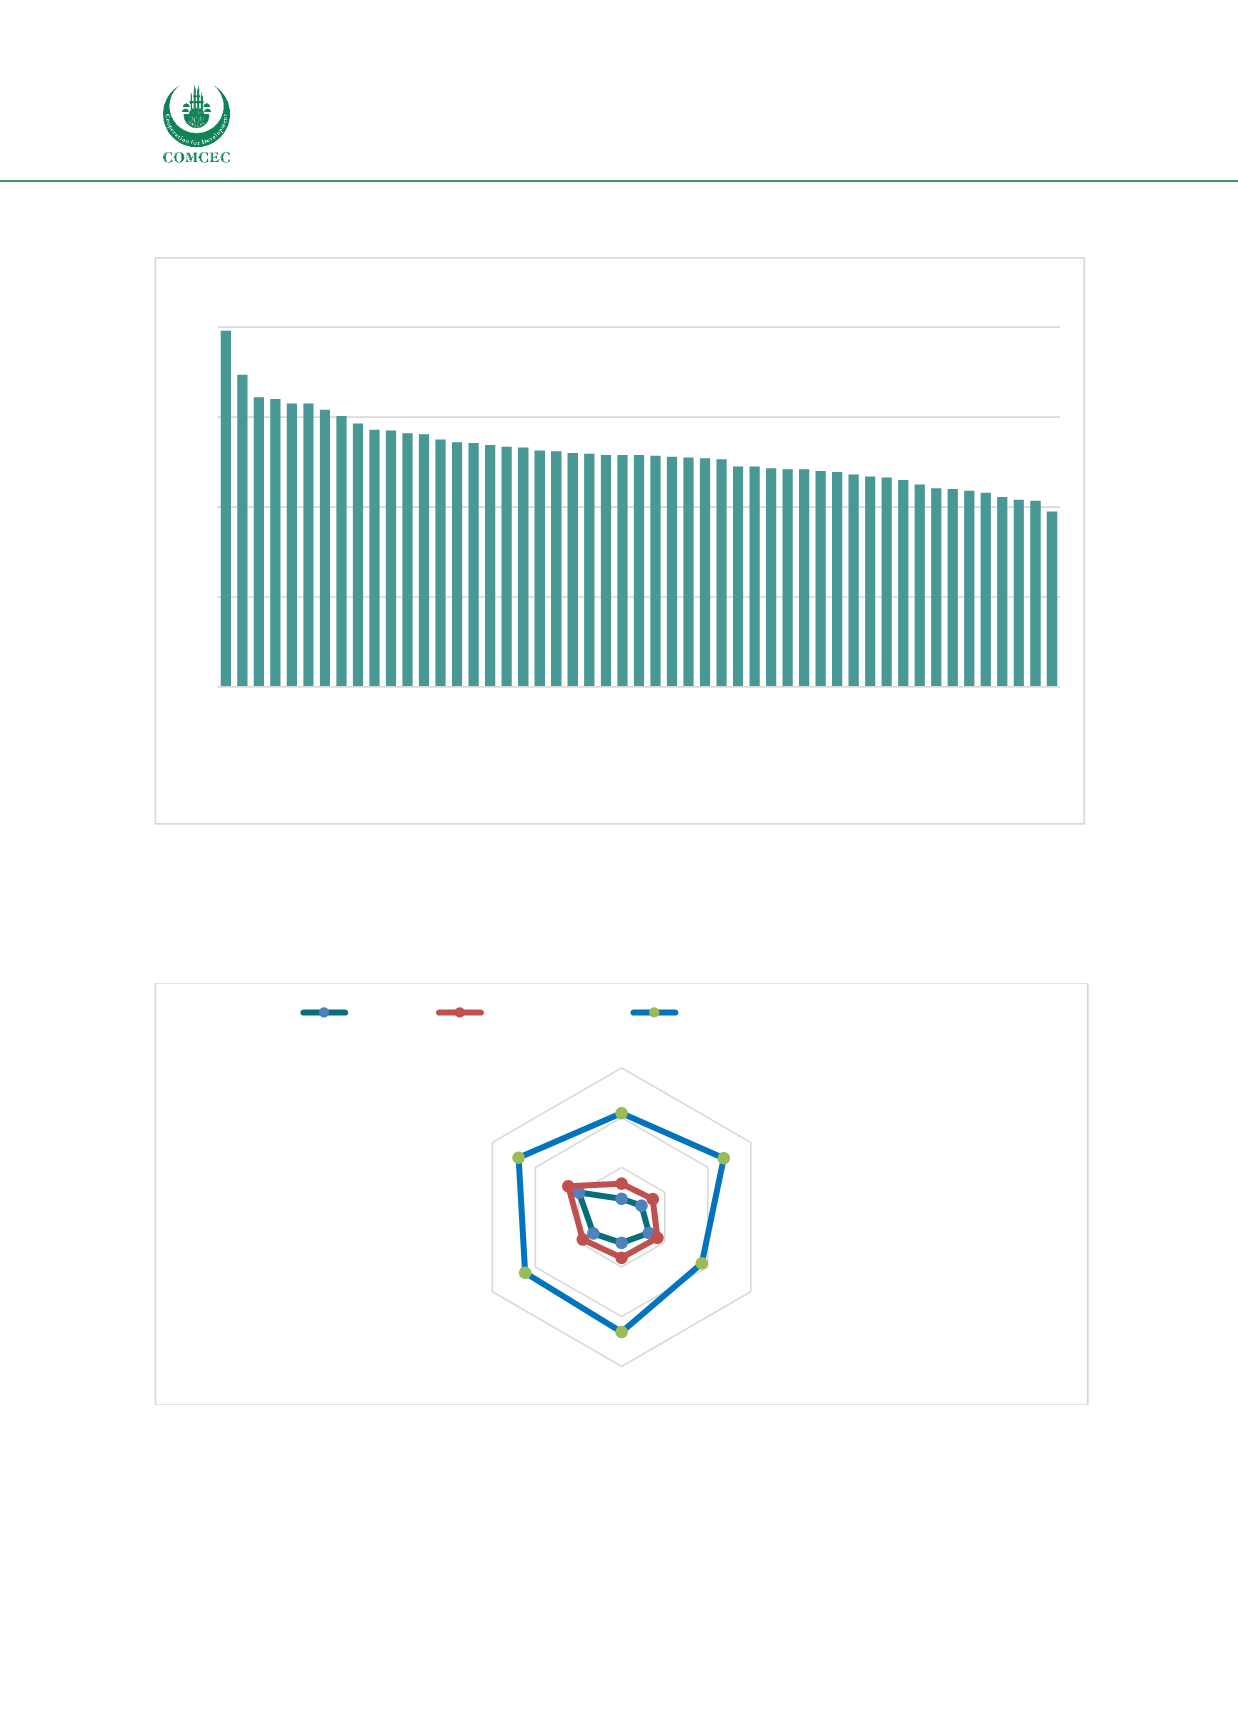
Figure 19: LPI score in OIC MS
Source: Authors’ own compilation
OIC MS LPI score is slightly below the global average LPI score for all six dimensions, except
when compared with the best performing country (Germany) (Figure 20).
Figure 20: Average LPI Score of OIC MS, Global and Best Performing Country (Germany)
Source: WB LPI
Comparing the LPI score, according to the level of economic development and geographic
distribution of the OIC, the highest score has high-income OIC MS from the Arab group. The
2
3
4
5
Customs
Infrastructure
International shipments
Logistics competence
Tracking & tracing
Timeliness
OIC MS
Global Average
Germany (best performing country)
3.96
3.47
3.22
3.2
3.15
3.15
3.08
3.01
2.93
2.86
2.85
2.82
2.81
2.75
2.72
2.71
2.69
2.67
2.66
2.63
2.62
2.6
2.59
2.58
2.58
2.58
2.57
2.56
2.55
2.54
2.53
2.45
2.45
2.43
2.42
2.42
2.4
2.39
2.36
2.34
2.33
2.3
2.25
2.21
2.2
2.18
2.16
2.11
2.08
2.07
1.95
0
1
2
3
4
United Arab Emirates
Qatar
Malaysia
Oman
Indonesia
Turkey
Côte d'Ivoire
Saudi Arabia
Bahrain
Kuwait
Iran
Egypt
Kazakhstan
Benin
Lebanon
Brunei Darussalam
Jordan
Maldives
Albania
Djibouti
Burkina Faso
Cameroon
Mali
Bangladesh
Uganda
Uzbekistan
Tunisia
Comoros
Kyrgyz Republic
Morocco
Nigeria
Algeria
Togo
Sudan
Chad
Pakistan
Gambia
Guinea-Bissau
Guyana
Tajikistan
Mauritania
Syria
Senegal
Somalia
Guinea
Iraq
Gabon
Libya
Sierra Leone
Niger
Afghanistan


