
Improving Customs Transit Systems
In the Islamic Countries
97
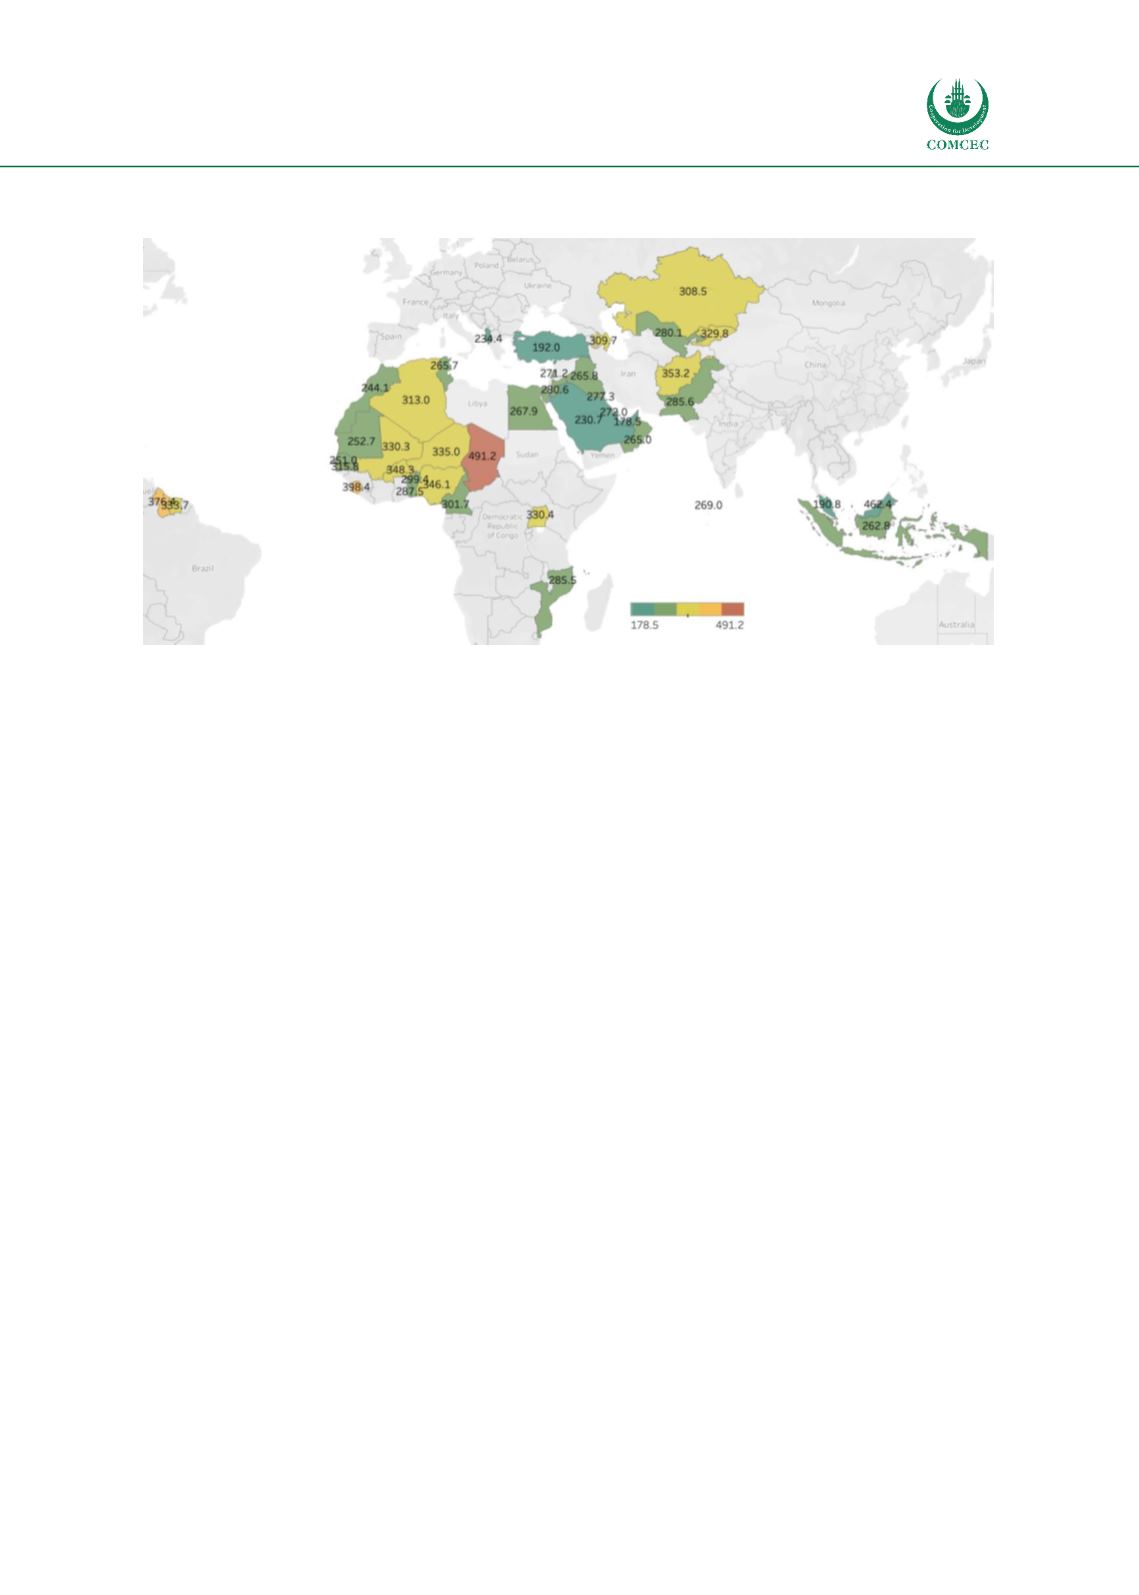
Figure 16: OIC MS and UN ESCAP trade costs database
Source: Authors’ own compilation
The mean of the trade costs according to UN ESCAP database for the OIC MS is 297.34%, and 23
Members States are below and inside mean value, while 17 MS have higher trade costs than the
mean value (Figure 17).
Comparing these costs with the geographic distribution and level of economic development
(Table 34) of the OIC MS, Arab countries have the lowest trade costs, all below the average of
the OIC MS. Asian countries with the lower and upper middle income have lower costs than
countries with the low and high income. On the other side, the highest trade costs have countries
from the African group, all above the average of OIC MS. The highest tariff costs as a part of these
costs have African group of countries (more than 41%), while Arab and Asian group of countries
have lower tariff costs with their trade partners (27.53% and 26.39%, respectively).


