
Improving Customs Transit Systems
In the Islamic Countries
98
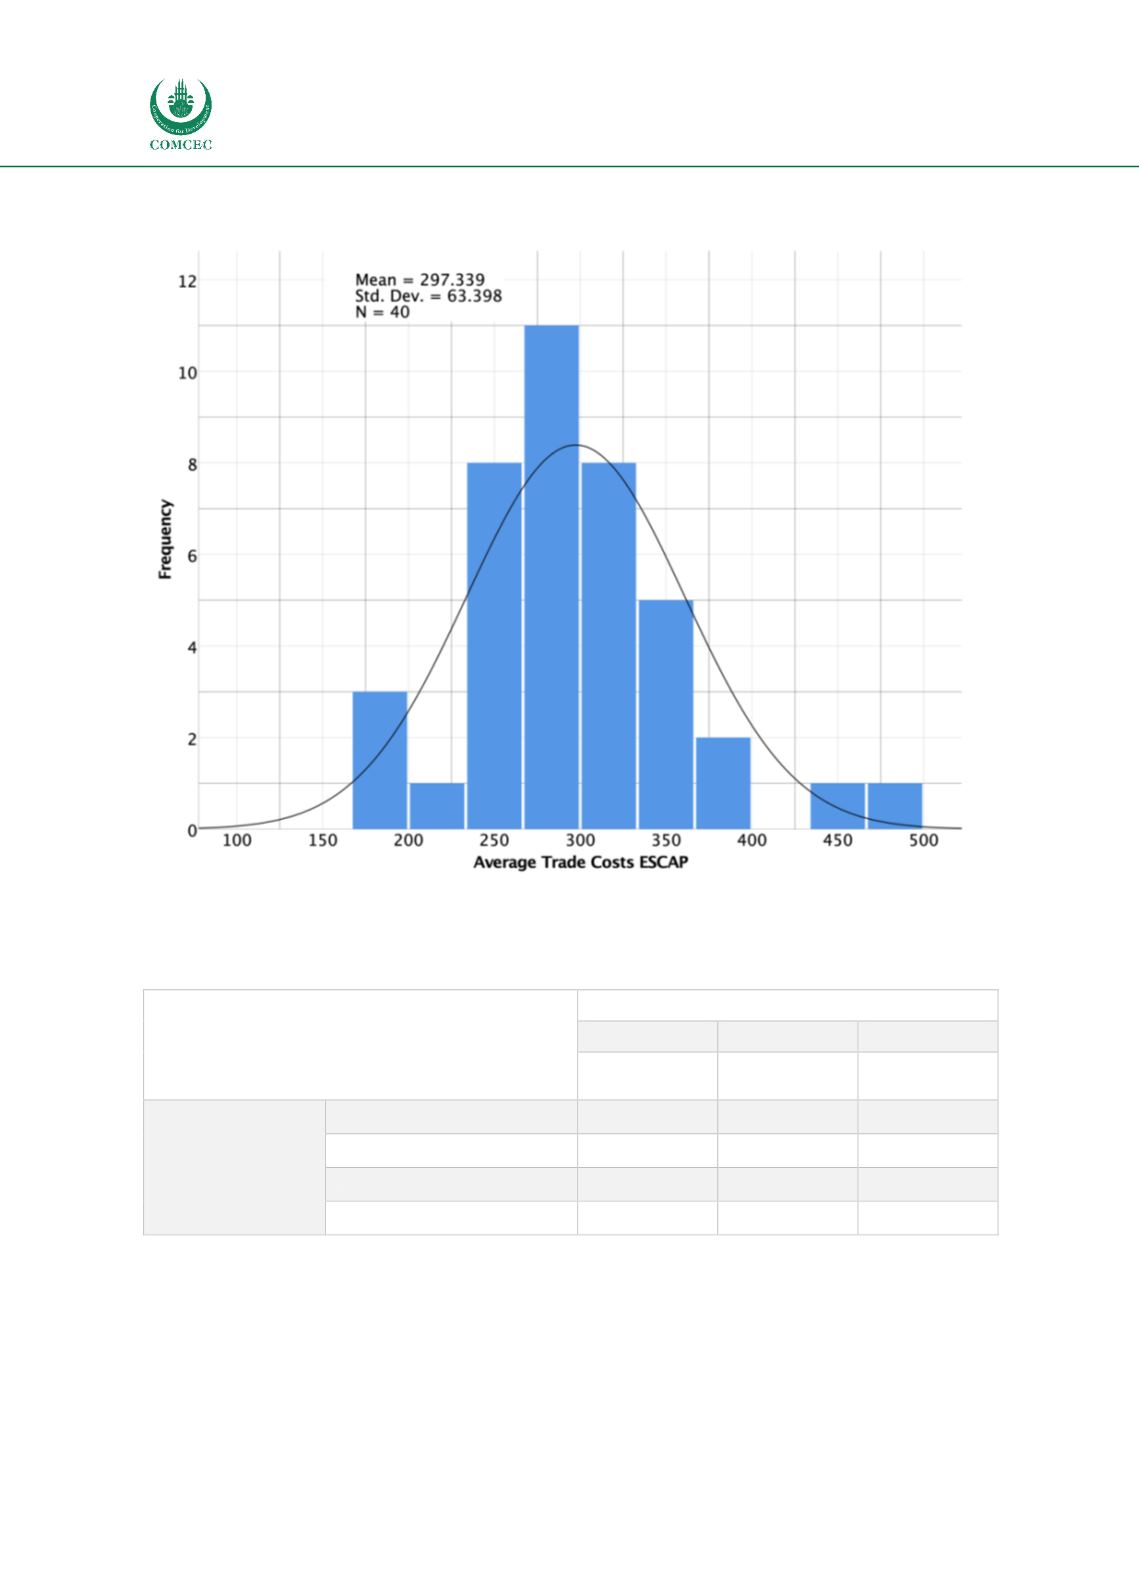
Figure 17: Average Trade Costs UN ESCAP database for 2016
Source: Authors’ own compilation
Table 34: Cross-tabulation of average trade costs (ESCAP) with geographic distribution and
level of economic development
Geographic distribution
African
Arab
Asian
Av. Trade
Costs
Av. Trade
Costs
Av. Trade
Costs
Level of
economic
development
High income
244.70%
386.03%
Upper middle income
330.29%
274.94%
285.67%
Lower middle income
379.66%
266.82%
269.80%
Low income
316.82%
252.69%
353.18%
Source: Authors’ own compilation
The impact of trade costs for landlocked MS from this analysis is evident. Maritime OIC MS have
lower average bilateral trade costs (282.57%) compared to landlocked countries whose costs
are 341.66% higher than for the domestic trade (Figure 18).


