
Reviewing Agricultural Trade Policies
To Promote Intra-OIC Agricultural Trade
27
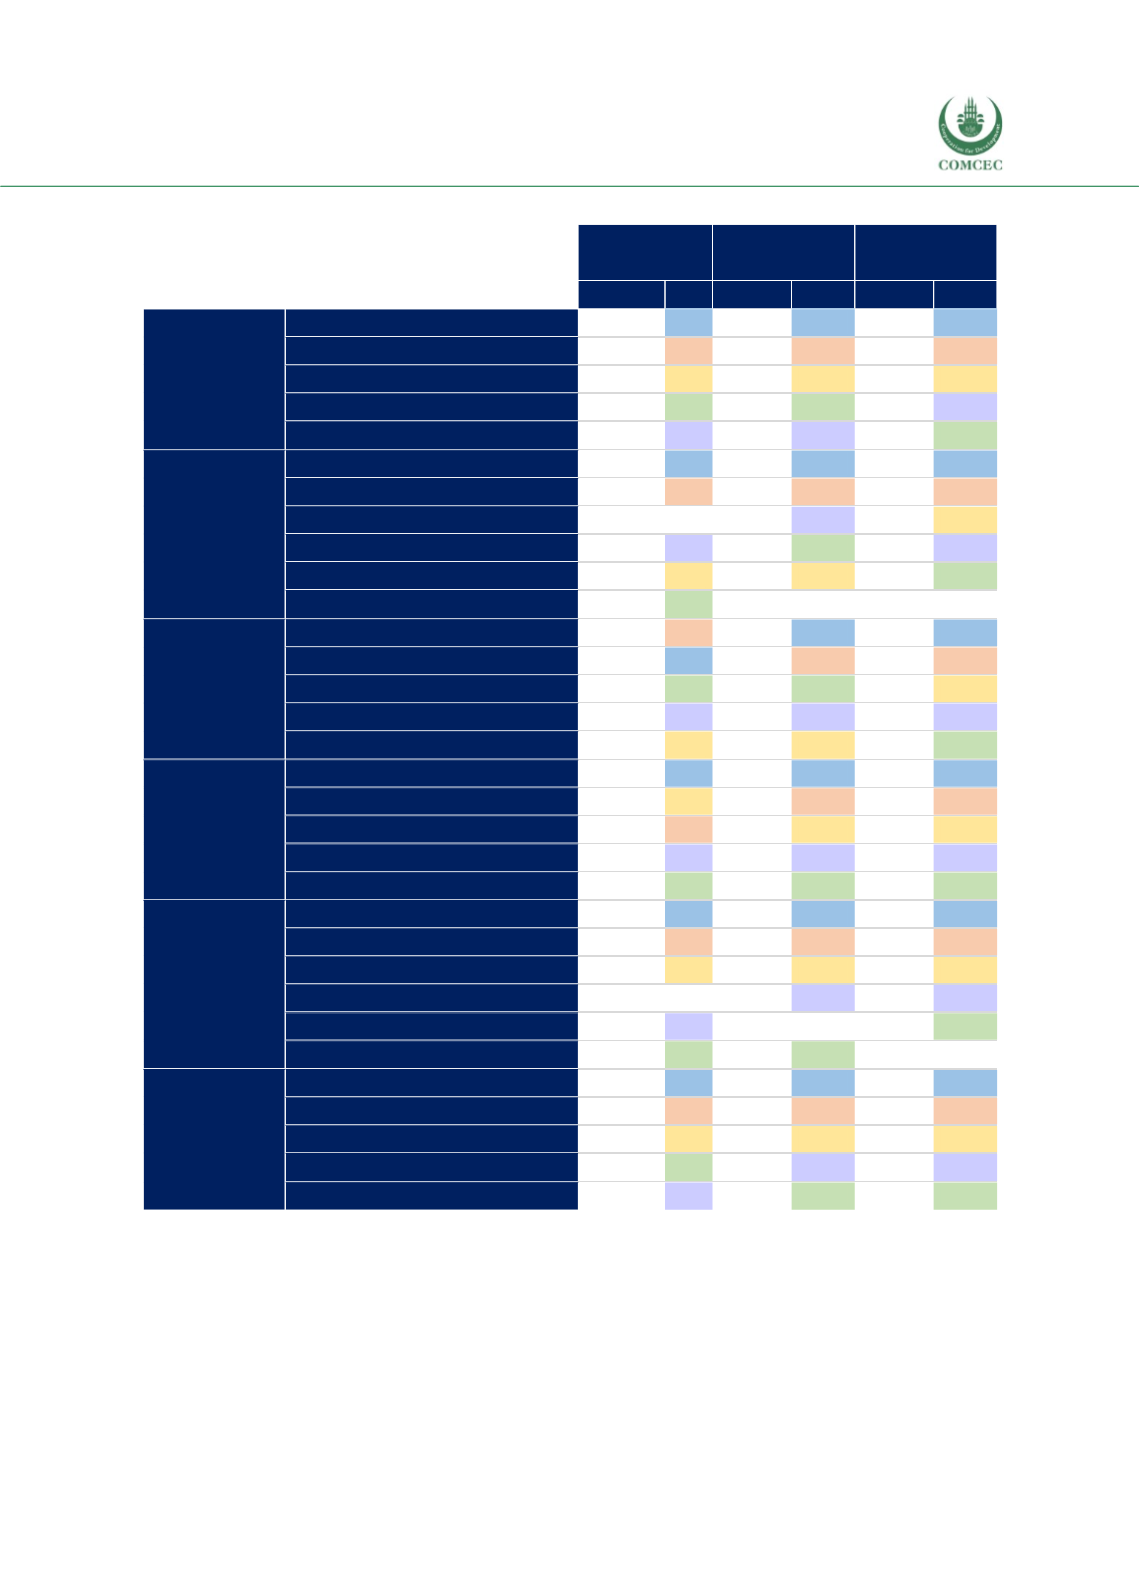
Table 2. 3 Top 5 Import Products of Major Trade Blocs
2016
2014-2016
Average
2008-2016
Average
Share
#
Share
#
Share
#
NAFTA
Vegetables, fruit
21.7
1
20.7
1
19.9
1
Beverages, tobacco
13.9
2
13.3
2
13.3
2
Fish
11.6
3
11.6
3
11.4
3
Cereals
8.5
5
8.7
5
9.1
4
Coffee, tea, cocoa, spices
8.7
4
8.7
4
8.8
5
MERCOSUR
Cereals
22.7
1
20.6
1
21.0
1
Vegetables, fruit
16.0
2
13.4
2
12.1
2
Meat
5.0
10
7.7
4
8.1
3
Oils, fats, waxe
7.1
4
7.4
5
7.4
4
Fish
7.9
3
7.8
3
7.0
5
Beverages, tobacco
6.9
5
6.6
7
6.3
8
ASEAN
Cereals
10.9
2
11.8
1
12.6
1
Vegetables, fruit
13.2
1
11.5
2
9.9
2
Feeding stuff for animals
8.7
5
9.4
5
9.5
3
Beverages, tobacco
9.6
4
9.5
4
9.1
4
Fish
10.6
3
9.8
3
8.7
5
EU-28
Vegetables, fruit
18.5
1
17.9
1
17.3
1
Meat
9.6
3
9.9
2
10.2
2
Beverages, tobacco
9.9
2
9.8
3
10.2
3
Coffee, tea, cocoa, spices
9.3
4
9.0
4
8.3
4
Fish
9.2
5
8.7
5
8.2
5
OIC
Cereals
20.8
1
22.6
1
24.1
1
Vegetables, fruit
12.4
2
11.5
2
10.2
2
Oils, fats, waxe
8.1
3
7.7
3
8.5
3
Dairy
6.1
7
6.8
4
6.7
4
Sugars
6.7
4
5.9
7
6.3
5
Beverages, tobacco
6.5
5
6.4
5
6.2
6
World
Vegetables, fruit
16.2
1
15.5
1
14.6
1
Cereals
10.4
2
10.9
2
11.4
2
Beverages, tobacco
9.5
3
9.3
3
9.3
3
Meat
8.8
5
8.9
4
8.9
4
Fish
8.9
4
8.6
5
8.3
5
Source: ITC Macmap, CEPII BACI, Eurostat RAMON, UN Comtrade, UN Trade Statistics, and authors’
calculations
Note: Colors represent the rankings. For OIC and MERCOSUR, 2016 ranking differs from the 2008-16
average and more than 5 product divisions appear in the table.


