


 37 / 213

Reviewing Agricultural Trade Policies
To Promote Intra-OIC Agricultural Trade
25
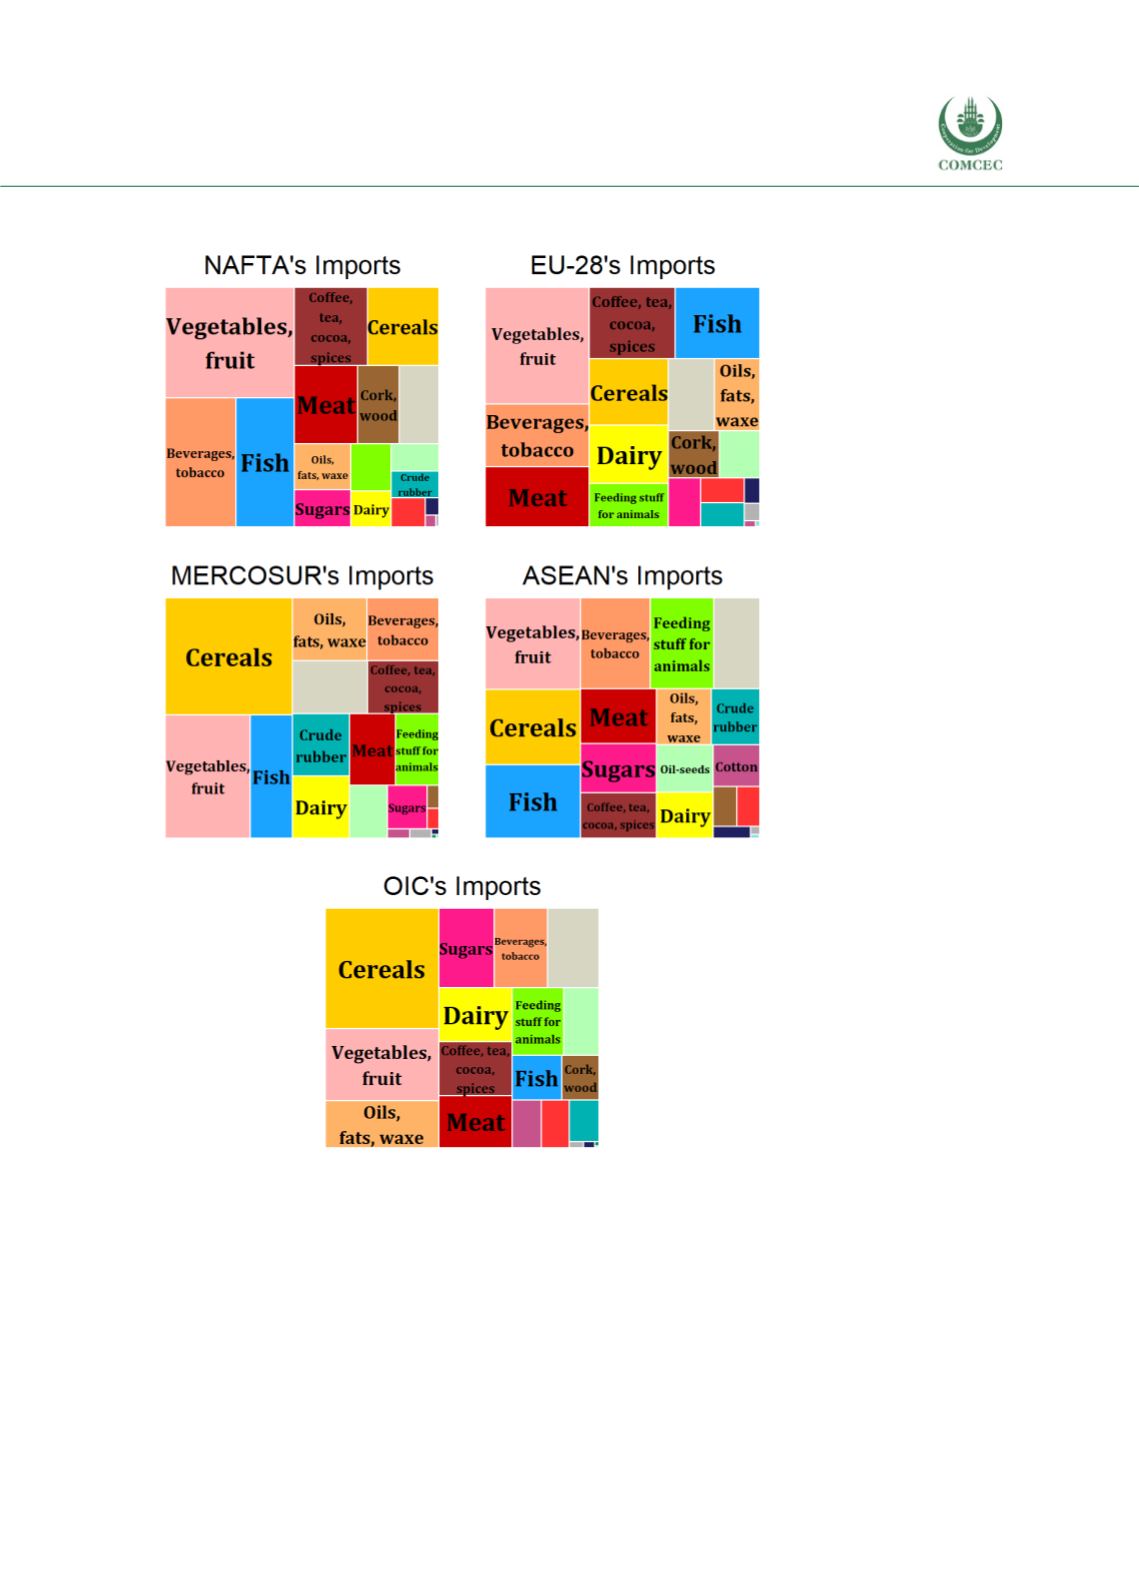
Figure 2. 7 Breakdown of Agricultural Imports by Major Trading Blocs, 2016
Source: ITC Macmap, CEPII BACI, Eurostat RAMON, UN Comtrade, UN Trade Statistics, and authors’
calculations
Table 2.2 and 2.3 gives the rank of the top 5 export and import products of the trading blocs as
well as OIC, according to the average of 2008-2016, to the average of the last three years and the
last year for which data is available, 2016. The ranks are differently colored to permit an easy
comparison. In Table 2.2 for the exports, it can be easily seen that NAFTA has only one differing
product division entering among the top 5 in the last three years (feeding stuff for animals. For
MERCOSUR, EU-28 and the World, top 5 export products divisions have been the same for the