


 34 / 213

Reviewing Agricultural Trade Policies
To Promote Intra-OIC Agricultural Trade
22
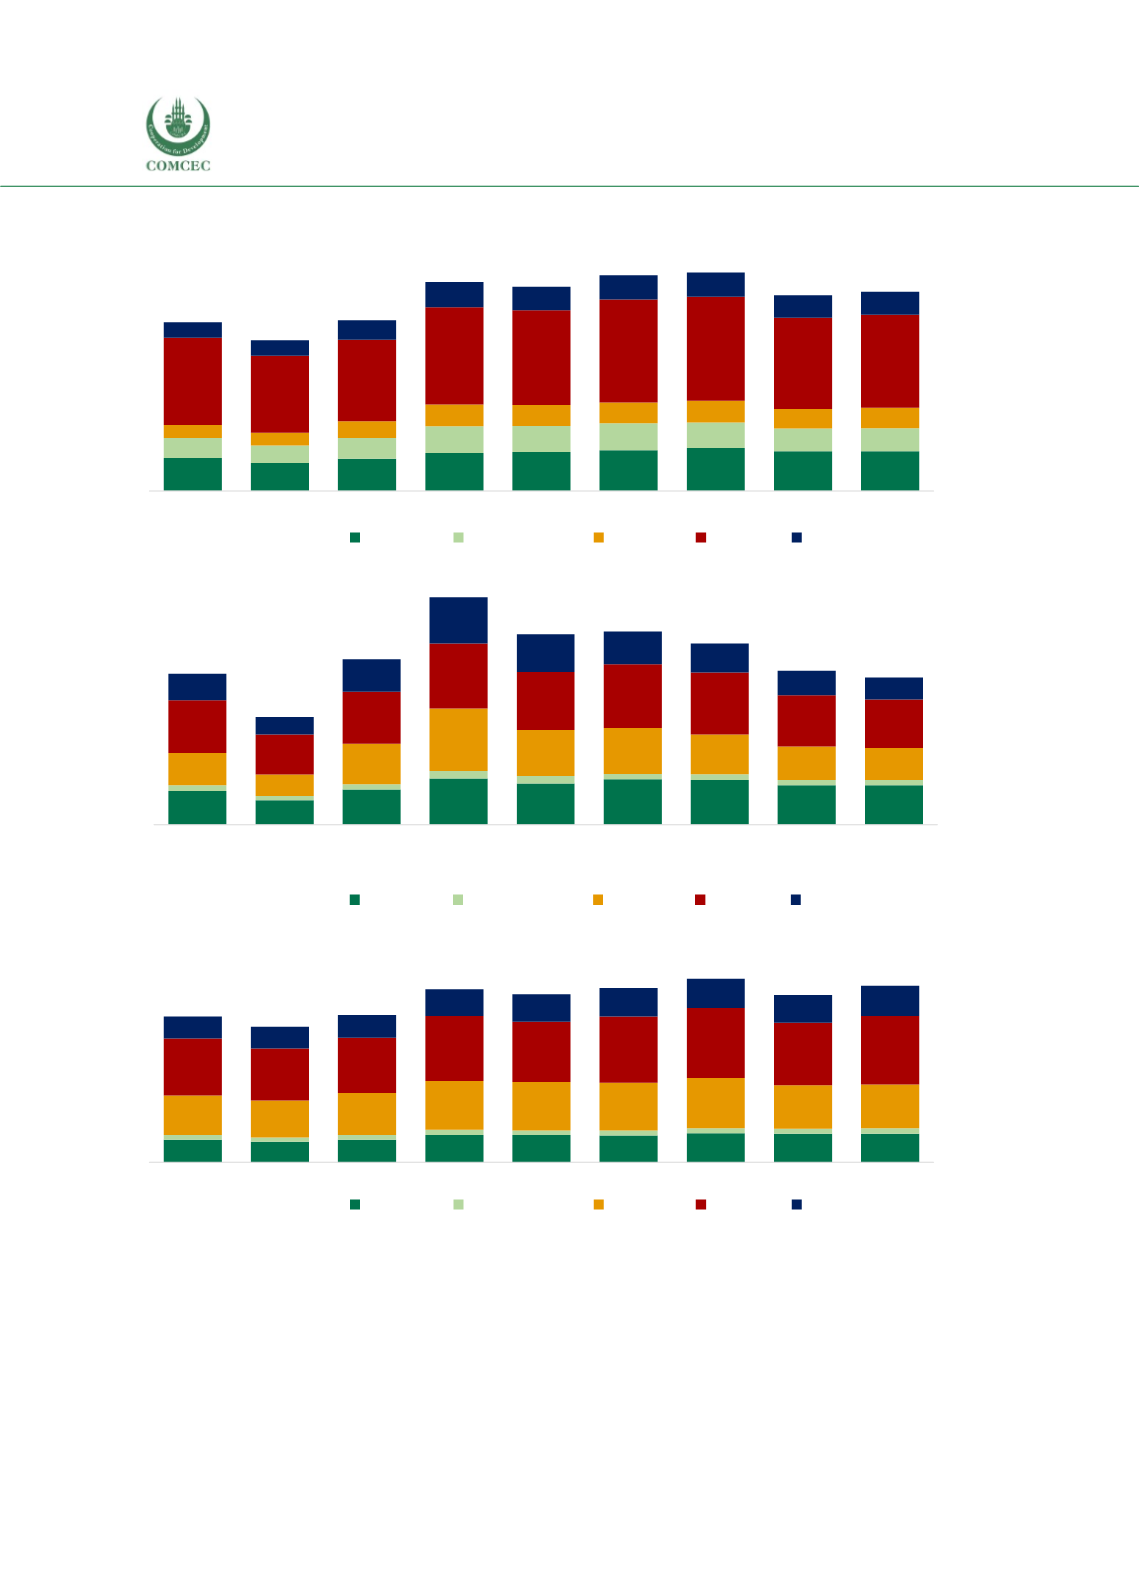
Figure 2. 4 Agricultural Exports by Major Trading Blocs, Billion USD, 2008-2016
Source: ITC Macmap, CEPII BACI, Eurostat RAMON, UN Comtrade, UN Trade Statistics, and authors’
calculations
Note: Three of OIC member countries, namely Brunei Darussalam, Indonesia and Malaysia are also ASEAN
members and the related double counting is inevitable but of minor importance.
165
141
161
190
196
204
215
199
200
100
87
104
133
131
137
129
116
115
66
66
84
110
106
103
110
98
102
440
387
411
490
476
519
524
459
469
77
79
98
126
120
122
121
113
116
2008
2009
2010
2011
2012
2013
2014
2015
2016
Agri-food Products
NAFTA MERCOSUR ASEAN EU-28 OIC
22
16
23
31
27
30
30
26
26
4
3
4
5
5
4
4
4
4
22
14
27
42
31
31
27
22
21
35
27
35
43
39
42
41
34
32
18
12
22
31
25
22
19
16
15
2008
2009
2010
2011
2012
2013
2014
2015
2016
Agricultural Raw Materials
NAFTA
MERCOSUR ASEAN EU-28 OIC
9
9
9
11
11
11
12
12
12
2
2
2
2
2
2
2
2
2
16
16
17
20
20
20
21
18
18
24
22
23
27
25
28
29
26
29
9
9
10
11
11
12
12
12
13
2008
2009
2010
2011
2012
2013
2014
2015
2016
Fish Products
NAFTA MERCOSUR ASEAN EU-28 OIC