
Facilitating Trade:
Improving Customs Risk Management Systems
In the OIC Member States
95
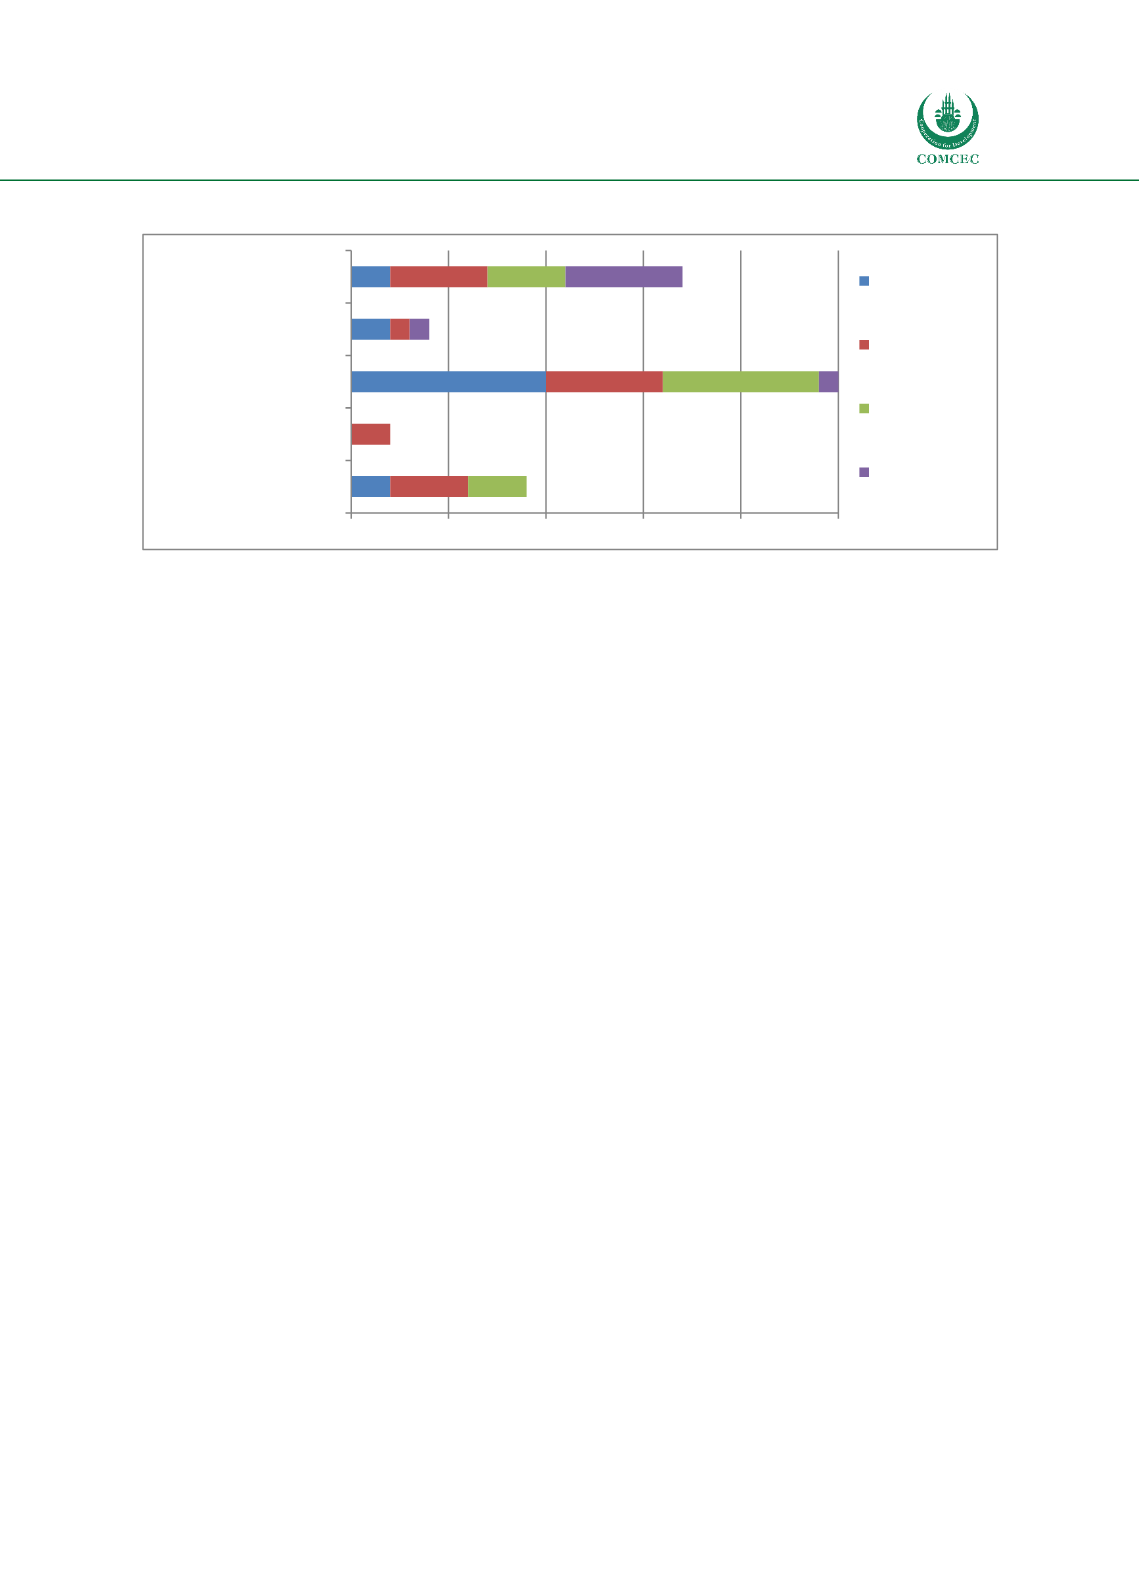
Figure 32: CRM Performances according to the economic development of the OIC MS
Author’s compilation
4.3.1.7
Performance linkage
between CRM and Doing Business Ranking
After assessing patterns with regards to economic performance, geography, we looked at the
Doing Business Ranking data. As mentioned in Chapte
r 2,the use of CRM is expected to deliver
benefits to traders regarding reducing costs and times for import and export. The analysis was
performed at the 2017 data to identify the level of Trading Across Border performance of OIC
MS and relate it to the level of CRM performance. The Trading Across Border measures time and
costs required for import and export of goods. It has to be noted that as multiple factors
influence the Trading Across Border indicator, a statistical analysis would therefore not yield
any significant results or the results can not at all be interpreted as meaning causality.
OIC MS performance varies from Albania (ranked 24
th
) to Yemen ranked 189
th
. In general, OIC
MS occupy a low WB Trading Across Border rank. By diving the OIC MS according to their
placement in the ranking, 16 are good or top performers, 19 are medium performers and 22 are
low performers. The six top performers are Albania Jordan, Malaysia, Morocco, Oman, and
Turkey. In fact, when looking at the time and costs indicators of the Trade Across Border
ranking, it appears that OIC MS suffer in particular from high costs and high time at import. OIC
MS average costs to import are 26 times higher than average costs of EU MS, approximately 2
times higher than ASEAN MS. The time to import, an average of 211 hours is higher than for
ASEANMS 148.5, but it is the gap to top performers such as the EUMS - 2,8 hours that is striking.
The following analysis combines the CRM performances data with the Doing Business Ranking
2017 data – see Figure 33.
3 or 5 % of the OIC MS are in the highest rank 1-49; one CA does not have a CRM and 2
CAs are with Medium CRM performances;
13 or 23% of the OIC MS are in the high-rank 50-99; one CA does not have implemented
a CRM, one has with Basic CRM performances, 3 CAs are with Medium CRM
performances, 3 have an Advances CRM performances, and five are with Full CRM
performances ;
19 or 33% of the OIC MS are in the low-rank 100-149; 3 CAs do not have implemented
CRM, 7 CAs are with Medium CRM performances, one has an Advances CRM
performance, and eight are with Full CRM performances;
And the biggest group, 22 or 39% of the OIC MS are in the lowest rank 150-190; 4 CAs
do not have implemented CRM, one with Basic CRM performances, 7 CAs are with
2
0
10
2
2
4
2
6
1
5
3
0
8
0
4
0
1
1
6
0
5
10
15
20
25
No CRM
Basic CRM
Medium CRM
performances
Advances CRM
Performances
Full CRM Performances
Low income
Lower middle
income
Upper middle
income
High income


