
Reducing Postharvest Losses
In the OIC Member Countries
70
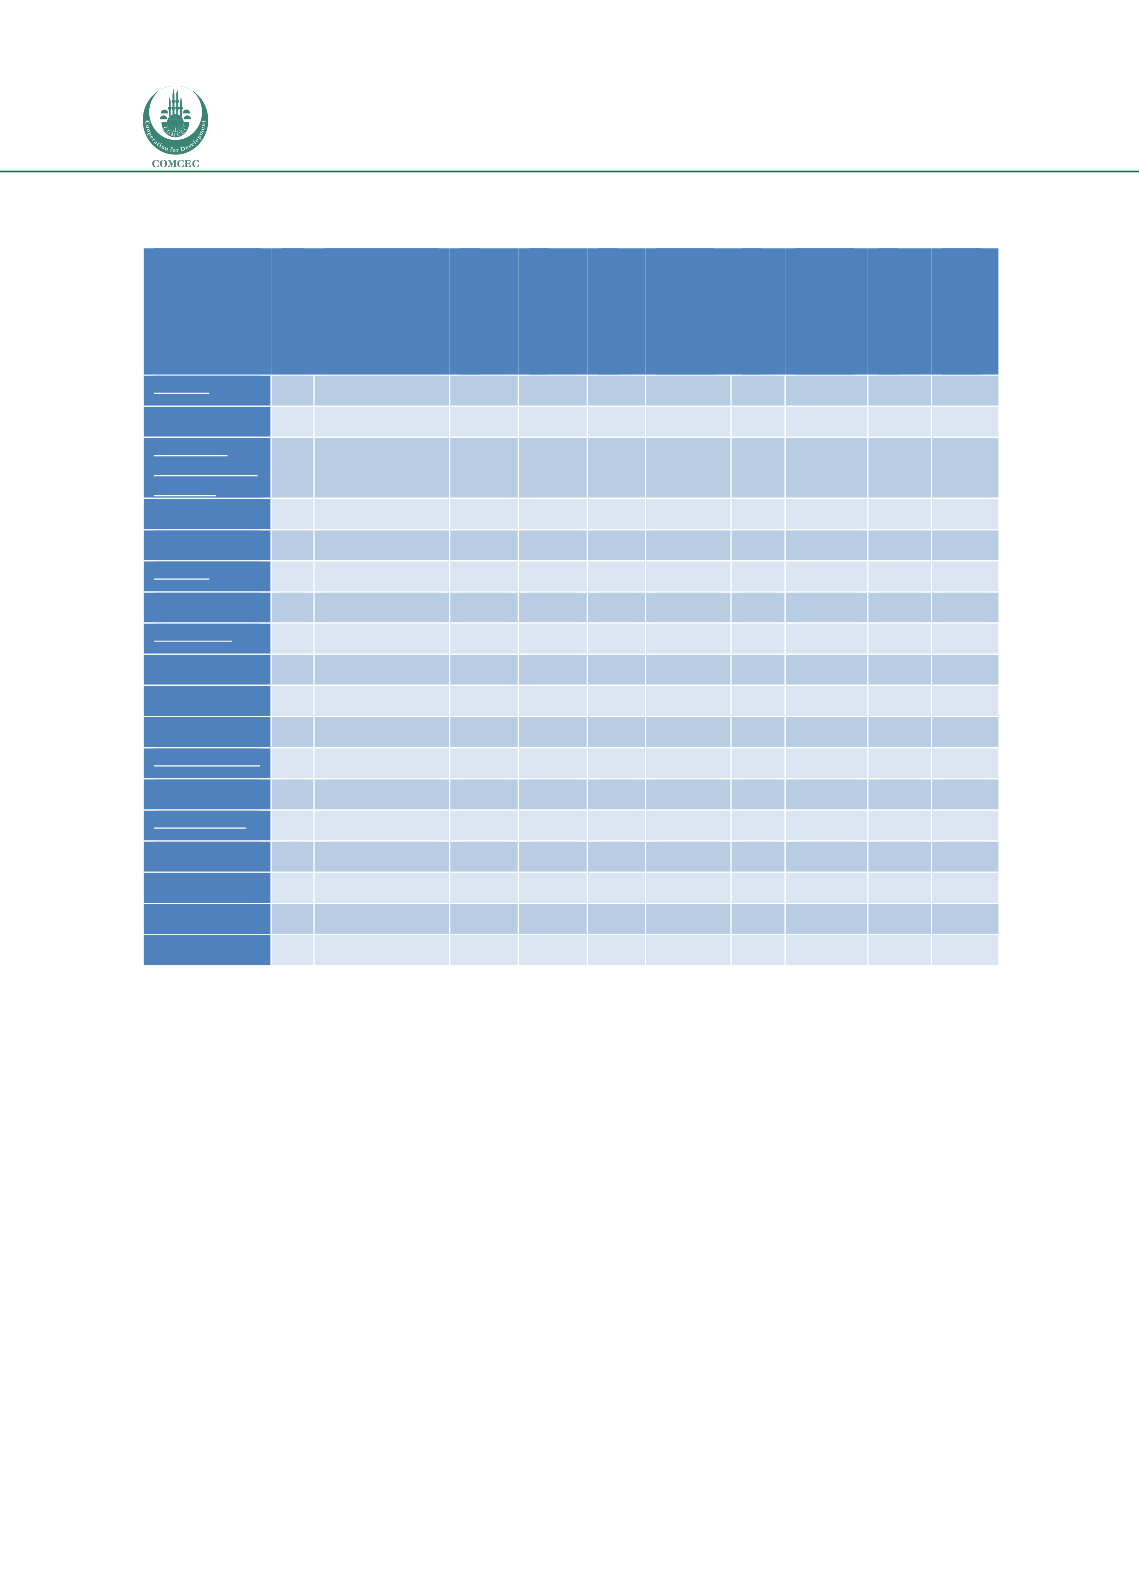
Table 33: Weight postharvest losses in fruits and vegetables per country and step of
postharvest
Fruit & veg./
country
N
Weight
Postharvest
losses (PHLs)
(%) (min-
max)
Harvesting
Storage
Marketing
Traders
handling and
sorting
Transporting
Wholesaler
and retailer
handling
Processing
Other (please
specify)
Grapes
1
32 (no range)
3
5
-
6
8
10
-
-
Uzbekistan
1
32
3
5
-
6
8
10
-
-
Mangoes,
mangosteens
, guavas
3
49 (35-65)
6
8
8
5
4
8
16
10
Nigeria
1
65
10
15
10
10
5
15
-
-
Pakistan
2
41
4
5
6
3
4
4
16
10
Onions
1
5 (no range)
-
-
-
7
6
4
0
-
Tajikistan
1
5
-
-
-
7
6
4
0
-
Tomatoes
5
37 (25-50)
11
29
10
11
19
13
10
-
Cameroon
1
25
2
10
15
15
20
15
-
-
Indonesia
1
30
10
5
5
0
10
-
-
Nigeria
3
43
15
35
10
13
25
15
10
-
Watermelons
1
30 (no range)
-
-
-
55
-
-
-
-
Nigeria
1
30
-
-
-
55
-
-
-
-
Other fruits
5
42 (20-50)
14
11
10
6
7
13
15
-
Lebanon
1
40
10
5
5
5
5
5
5
-
Nigeria
2
50
20
20
20
7
9
18
10
-
Tajikistan
2
35
5
9
5
-
5
10
23
-
Total
16
38 (5-65)
10
16
10
11
11
11
13
10
Note: Number of respondents (N).
Three respondents did not complete the estimate PHLs in terms of weight and value. As a
result only 16/19 respondents commented on fruits and vegetables PHL estimate. On average
losses were 38% ranging between 5 and 65%. This large variability can be explained by the
variety of fruits and vegetable cited in the survey. A minimal loss was reported for onions (5%)
whilst more important losses were reported with more fragile fruits such as mangoes,
tomatoes and other fruits. Losses were spread almost equally at each step of the value chain:
harvesting, storage, marketing, handling, transporting and processing and shows that a close-
look at each step is required for fruits and vegetables that are easily susceptible to damage.
Causes for the PHLs in fruits and vegetables are presented i
n Table.


