


 106 / 194

Reducing Postharvest Losses
In the OIC Member Countries
92
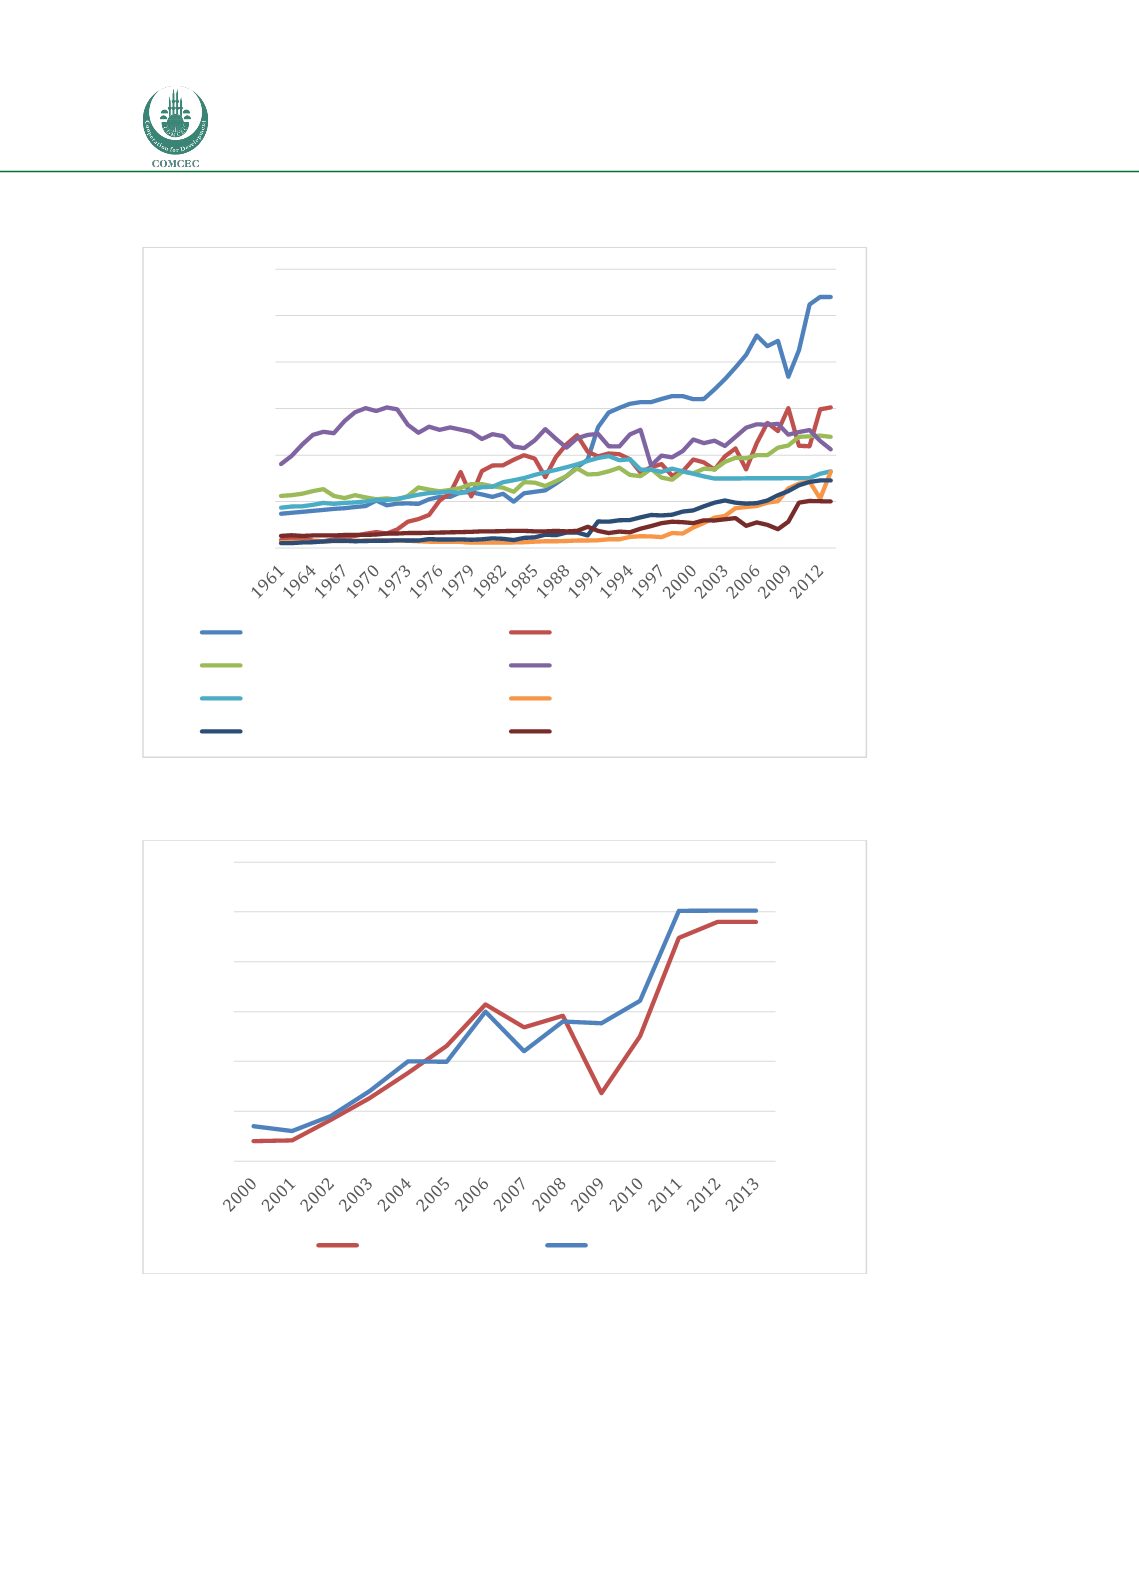
Figure 12: Trends in cassava production in Nigeria and other top producing country from
1960 to 2013.
Source: Authors own analysis of FAO data.
Figure 13: Relationship between trends in cassava production and yield in Nigeria between
2000 and 2013
.
Source: Authors own analysis of FAO data.
Cassava production has been increasing and is expected to increase as Nigeria’s population is
expected to increase to 440 million in 2050 year from the current 182 million in 2015 ("World
Population Prospects The 2012 Revision" (PDF). United Nations. Retrieved 6 September
2013.). The utilization of cassava in South-West Nigeria is illustrated i
n Table. This is related
0
10
20
30
40
50
60
Production (tonnes)
x 1000000
Nigeria
Thailand
Indonesia
Brazil
Democratic Republic of the Congo
Angola
Ghana
Mozambique
9
10
11
12
13
14
15
30
35
40
45
50
55
60
Yield (tonnes/Ha)
Production (million tonnes)
Production (tonnes)
Yield (Hg/Ha)