
Improving Institutional Capacity:
Strengthening Farmer Organizations in the OIC Member Countries
21
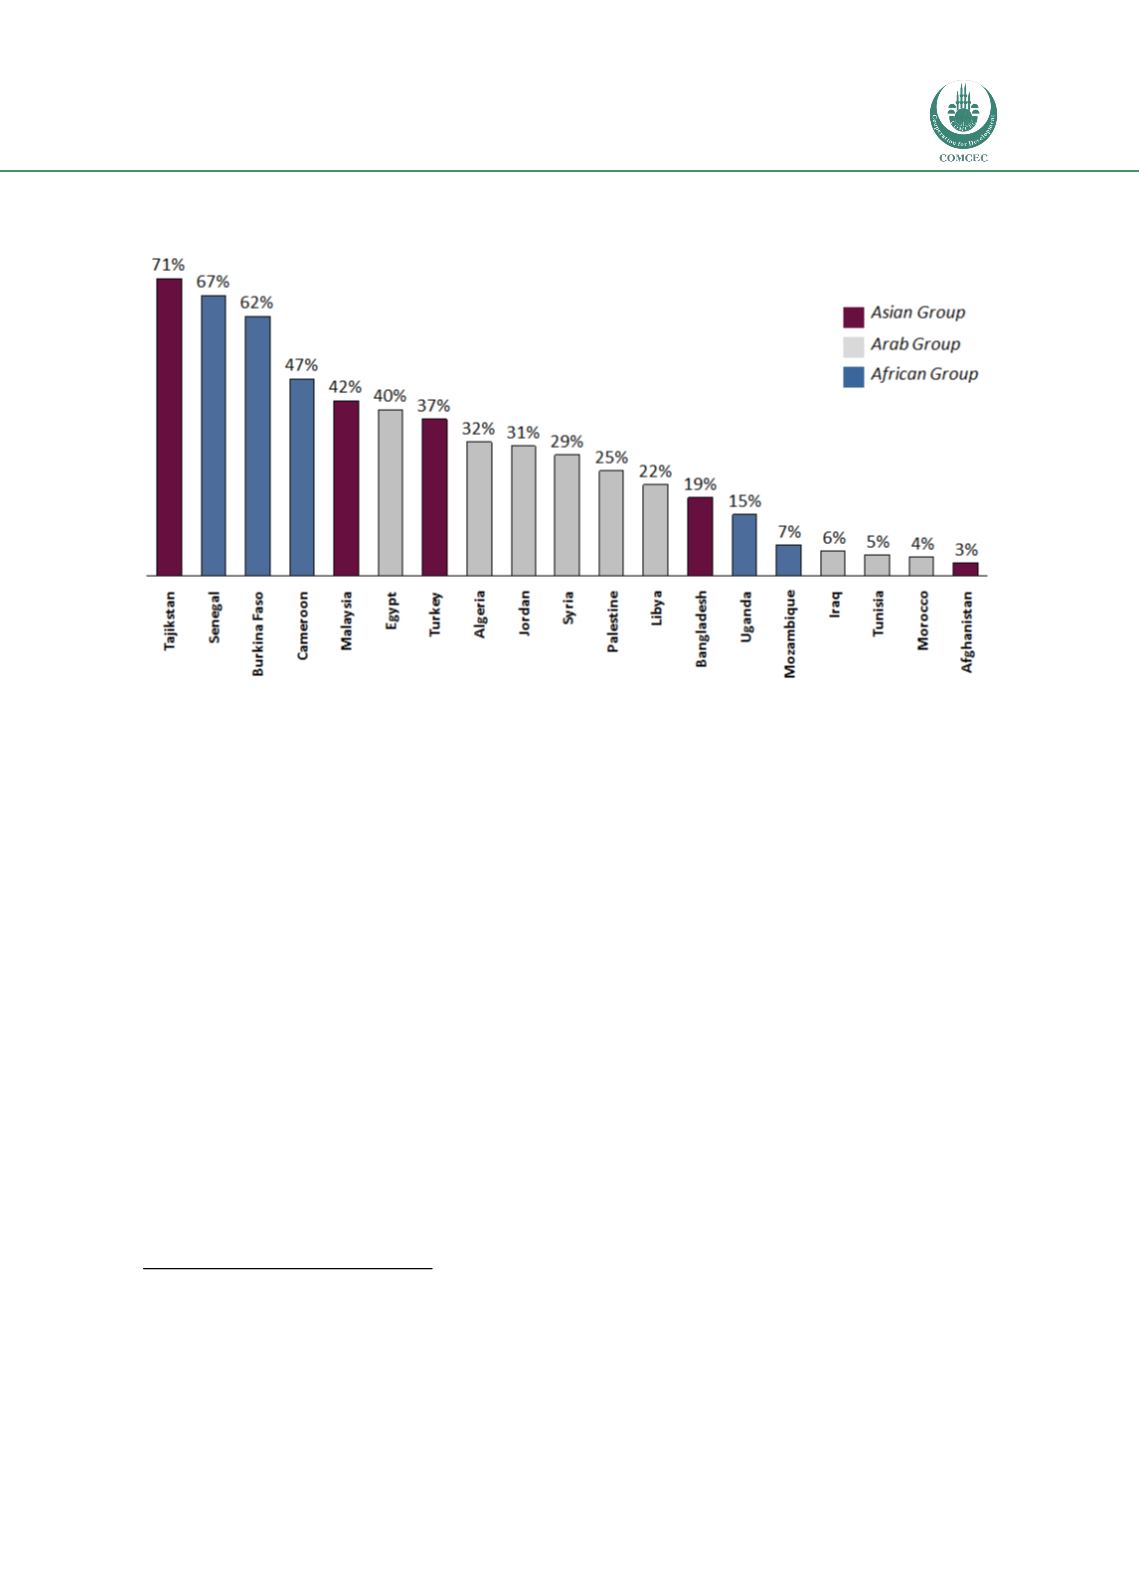
Figure 4: Estimated share of farmers (or farm labor force) belonging to farmer organizations
or rural co-operatives
26
Regional trends are difficult to state with any confidence, due to the small sample size but it is
noteworthy that the mean share of farmers in FOs is lower in the Arab Group, at
22%,
vs
37%
for the African and Asian Groups, although this masks an extremely wide range of outcomes
within regions (as shown above).
As noted above, this type of information is not tracked globally by any organization, so
comparisons between the OIC and other parts of the world are difficult. However, it is possible
to compare the OIC average with some other representative countries that have significant
agricultural sectors. The figure below presents data from seven non-OIC countries of various
income levels and demonstrates that, on average, the OIC is well-positioned in terms of the
strength of farmer organizations in its member states. However, as discussed below, the lack of
readily-available, standardized data in both the OIC and in other countries means that it is not
possible to definitively state how the OIC compares to the world average.
26
Data are drawn from a variety of in-country sources - most commonly the national Ministry of Agriculture or leading
universities - and international publications – most commonly the ILO’s Country Reports, the Food and Agriculture
Organization (FAO), AgriTerra, and the World Bank - and reflect the most recent available information, generally from the
past 10 years. However, some data points are older and thus estimates of share of farmers belonging to FOs may be biased
downwards due to population growth. Full notes and calculations by country, and the sources used for the statistics, are
given i
n Figure 16 throug
h Figure 18 in Annex 1.2


