
Improving Institutional Capacity:
Strengthening Farmer Organizations in the OIC Member Countries
23
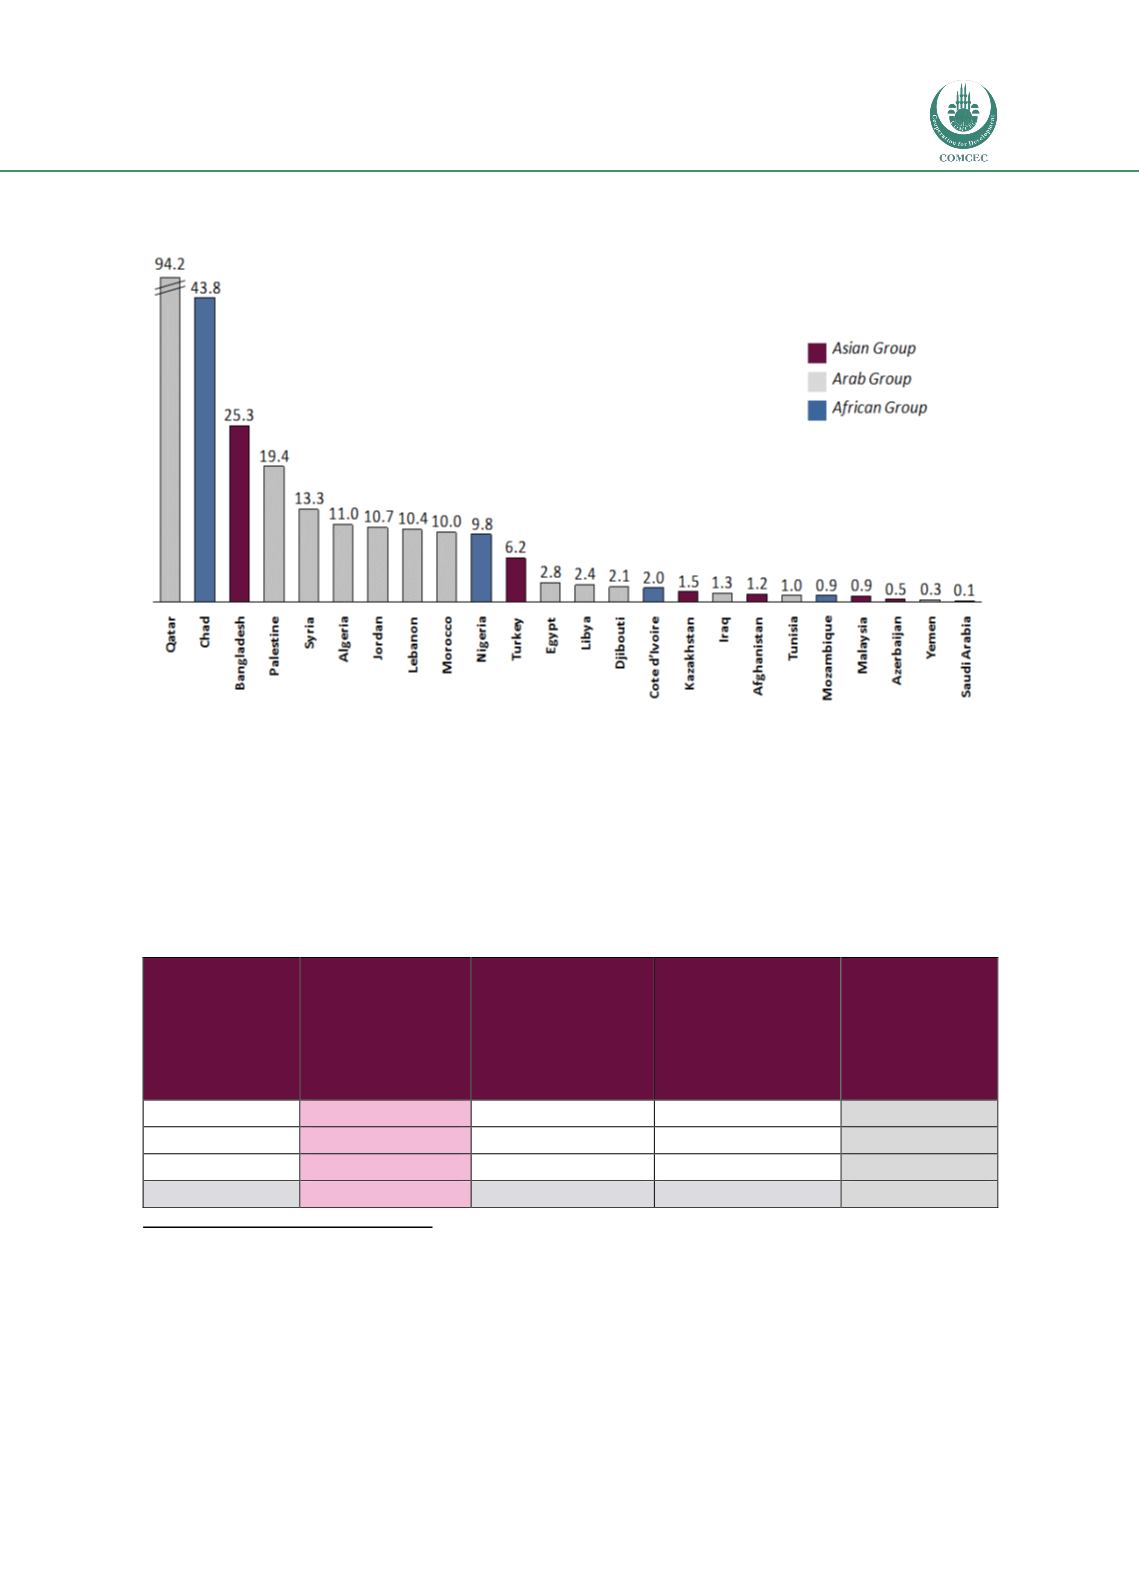
Figure 6: Estimated number of farmer organizations / co-operatives per 10,000 people in
the agricultural labor force
28
Again, a very wide range in the number of co-operatives can be noted, with a median value of
2.8 organizations per 10,000 farm labor force. When this is compared to the first figure, it
becomes clear that countries with >20% of farmers in farmer organizations (relatively
strong
environments
) have a median and mean value of
10-11 FOs per 10,000 farm labor force
,
whereas countries with <10% of farmers in FOs (
less strong environments)
have a median
and mean of
only 1 FO per 10,000
. Based on this finding, the study then combines data from
the 19 countries in
Figure 4with the 10 new countries in
Figure 6 to present an aggregate
picture of FO strength across the OIC and within the different regions:
Table 2: Strength of FO movements in OIC member countries
29
Group
Very strong FO
movement
(>50% farmers
in FOs or >20
FOs per 10,000
farm labor force
Strong FO
movement
(20-50% in FOs
or 5-20 FOs per
10,000 farm
labor force
Less strong FO
movement
(<20% in FOs or
<5 FOs per 10,000
farm labor force
No data:
Significant
need for
better
information
African Group
24%
6%
18%
53%
Arab Group
9%
27%
27%
36%
Asian Group
17%
8%
33%
42%
Total
16%
16%
25%
43%
28
Data are drawn from a variety of in-country sources - most commonly the national Ministry of Agriculture or leading
universities - and international publications – most commonly the ILO’s Country Reports, the Food and Agriculture
Organization (FAO), AgriTerra, and the World Bank - and reflect the most recent available information, generally from the
past 10 years. . However, some data points are older and thus estimates of FOs per 10,000 people may be biased downwards
due to population growth. Full notes and calculations by country, and the sources used for the statistics, are given i
n Figure 16throug
h Figure 18 in Annex 1.2
29
These statistics are calculated based on the sample of countries covered by the research (51 out of 57 OIC countries). Full
categorization by country, and the sources used for the statistics, are given i
n Figure 16throug
h Figure 18in Annex 1.2


