


 50 / 206

Improving Agricultural Statistics in the COMCEC Region
38
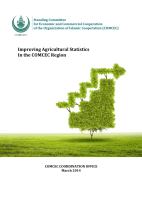
average delay of half a year. Among the groups, it appears that the Asian group has the most
recent statistics available, with an average delay of 0.7 years, while the African group has the
oldest data available with an average delay of 1.1 years (Table 22).
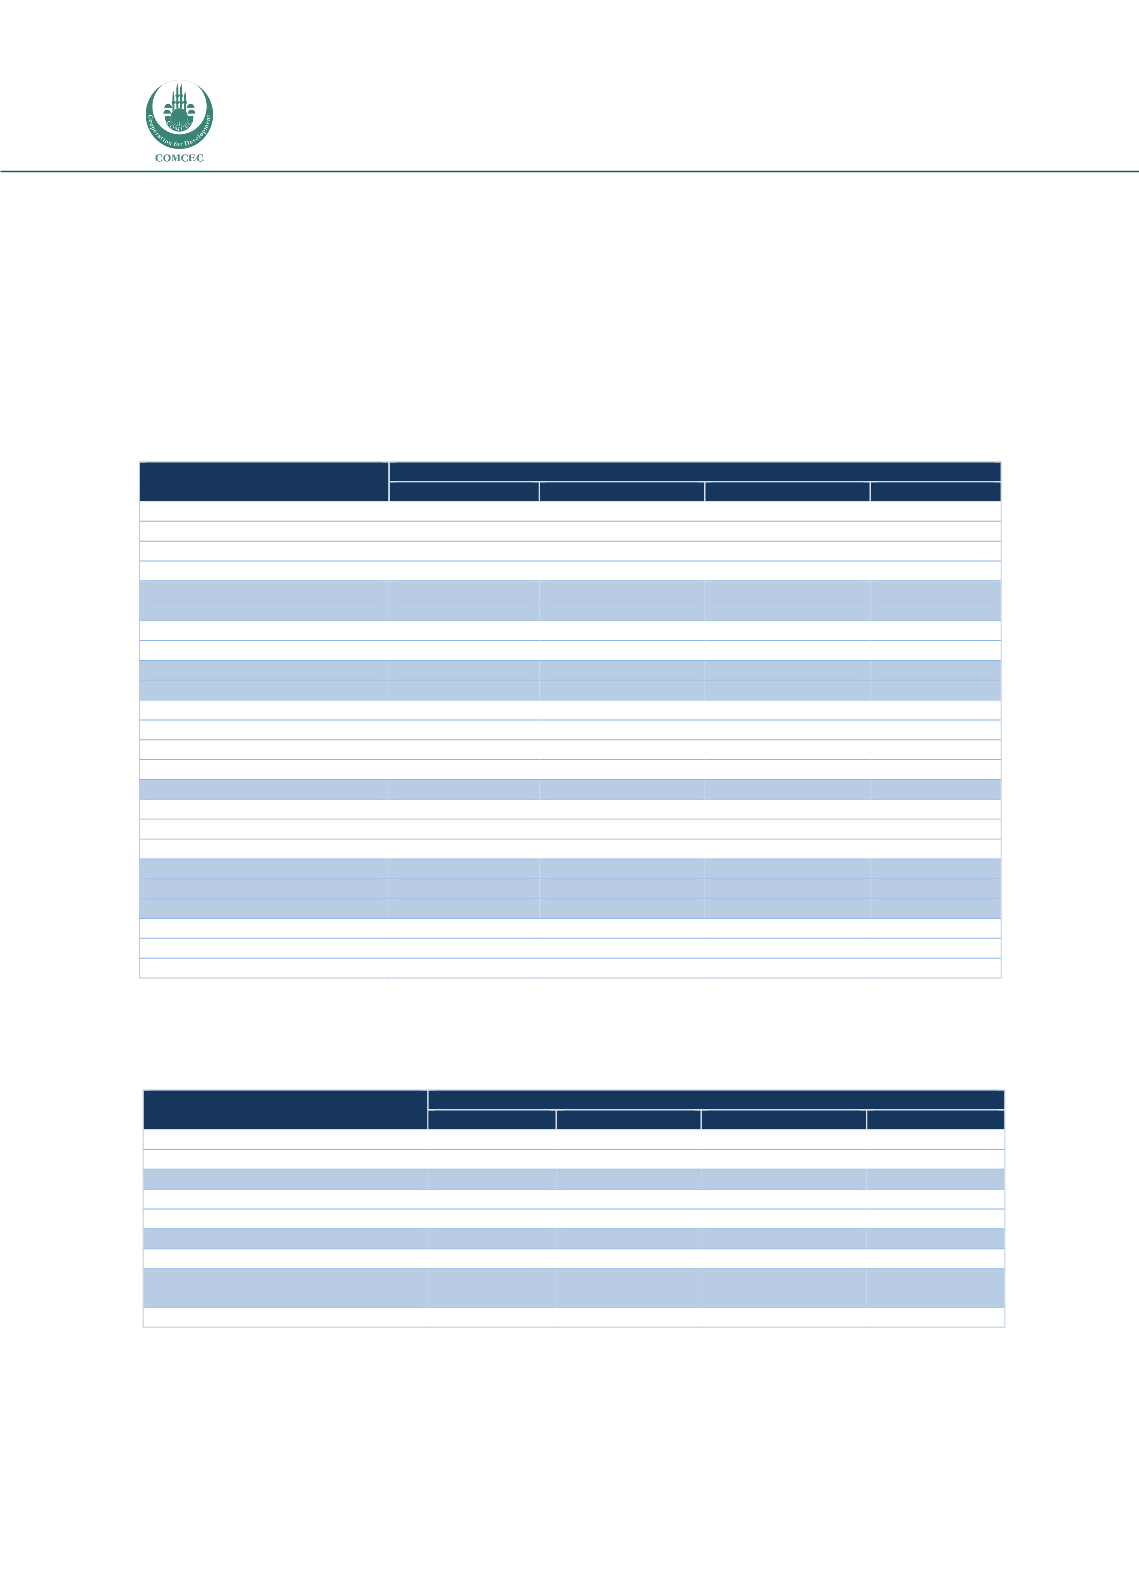
As far as the statistical indicators are concerned, the average delay for COMCEC Members is
little more than a year, on the average. For African and Asian groups the delay is around one
year and for Asian group it is 8 months. Largest delays are observed in the areas of rural
income, income distribution and agro-environmental indicators (Table 23).
Table 22: Timeliness of Agricultural Statistics
Delay of Availability Score (Years)
African Group
Arab Group
Asian Group
COMCEC
Crop Production
0.75
0.92
0.36
0.69
Harvested Area
0.75
1.00
0.36
0.72
Yield per hectare
0.82
0.83
0.36
0.68
Livestock Production
0.73
1.09
0.55
0.79
Forest Products
1.13
1.13
0.90
1.04
Fishery Products
0.90
0.73
1.00
0.87
Agricultural Exports
0.89
0.58
0.00
0.48
Agricultural Imports
0.89
0.54
0.00
0.47
Producer Prices
0.70
0.64
0.1
0.48
Agricultural Input Prices
0.75
0.60
0.25
0.56
Consumption (Quantity)
1.67
1.63
0.82
1.28
“ (Calories)
1.60
1.50
0.67
1.20
“ (Protein)
1.50
1.50
0.60
1.09
“ (Fats)
1.50
1.50
0.67
1.08
Land Use
1.13
1.10
0.90
1.04
Rural Population
0.73
1.00
1.30
1.00
Active Population
1.09
0.50
0.88
0.88
Labor Force
1.11
0.78
1.00
0.96
Machinery
1.38
1.38
1.00
1.23
Fertilizers
1.13
1.22
0.89
1.08
Pesticides
1.25
1.22
1.00
1.16
Rural Infrastructure
1.20
1.40
1.33
1.31
Rural Employment
1.43
0.40
1.00
1.00
Agricultural Credit
1.00
1.17
1.00
1.06
Note: Delay calculations assumes 2013 and after are current, 2012 is one year late, 2011 or before are two
years late. Average Delay = Sum of Delay/Number of Sampled Countries
Source: SSAQ Results.
Table 23: Timeliness of Agricultural Indicators
Delay of Availability Score (Years)
African Group
Arab Group
Asian Group
COMCEC
Agricultural GDP
1.10
0.82
0.27
0.72
Rural Income
2.00
1.33
1.13
1.40
Terms of Trade
1.00
1.00
0.38
0.69
Output Price Index
1.30
0.80
0.11
0.65
Input Prices Index
1.00
1.00
0.00
0.75
Agrio- Environmental Indicators
1.50
1.25
1.00
1.29
Food Balance Sheets
1.00
1.00
0.33
0.70
Agricultural/Rural Income
Distribution
-
1.33
1.50
1.43
Land Distribution
-
1.00
1.60
1.54
Note: Delay calculations assumes 2013 and after are current, 2012 is one year late, 2011 or before are two
years late. Average Delay = Sum of Delay/Number of Sampled Countries
Source: SSAQ Results.