


 52 / 206

Improving Agricultural Statistics in the COMCEC Region
40
geographical disaggregation is observed in traditional areas of statistics and when the sources
of data are administrative.
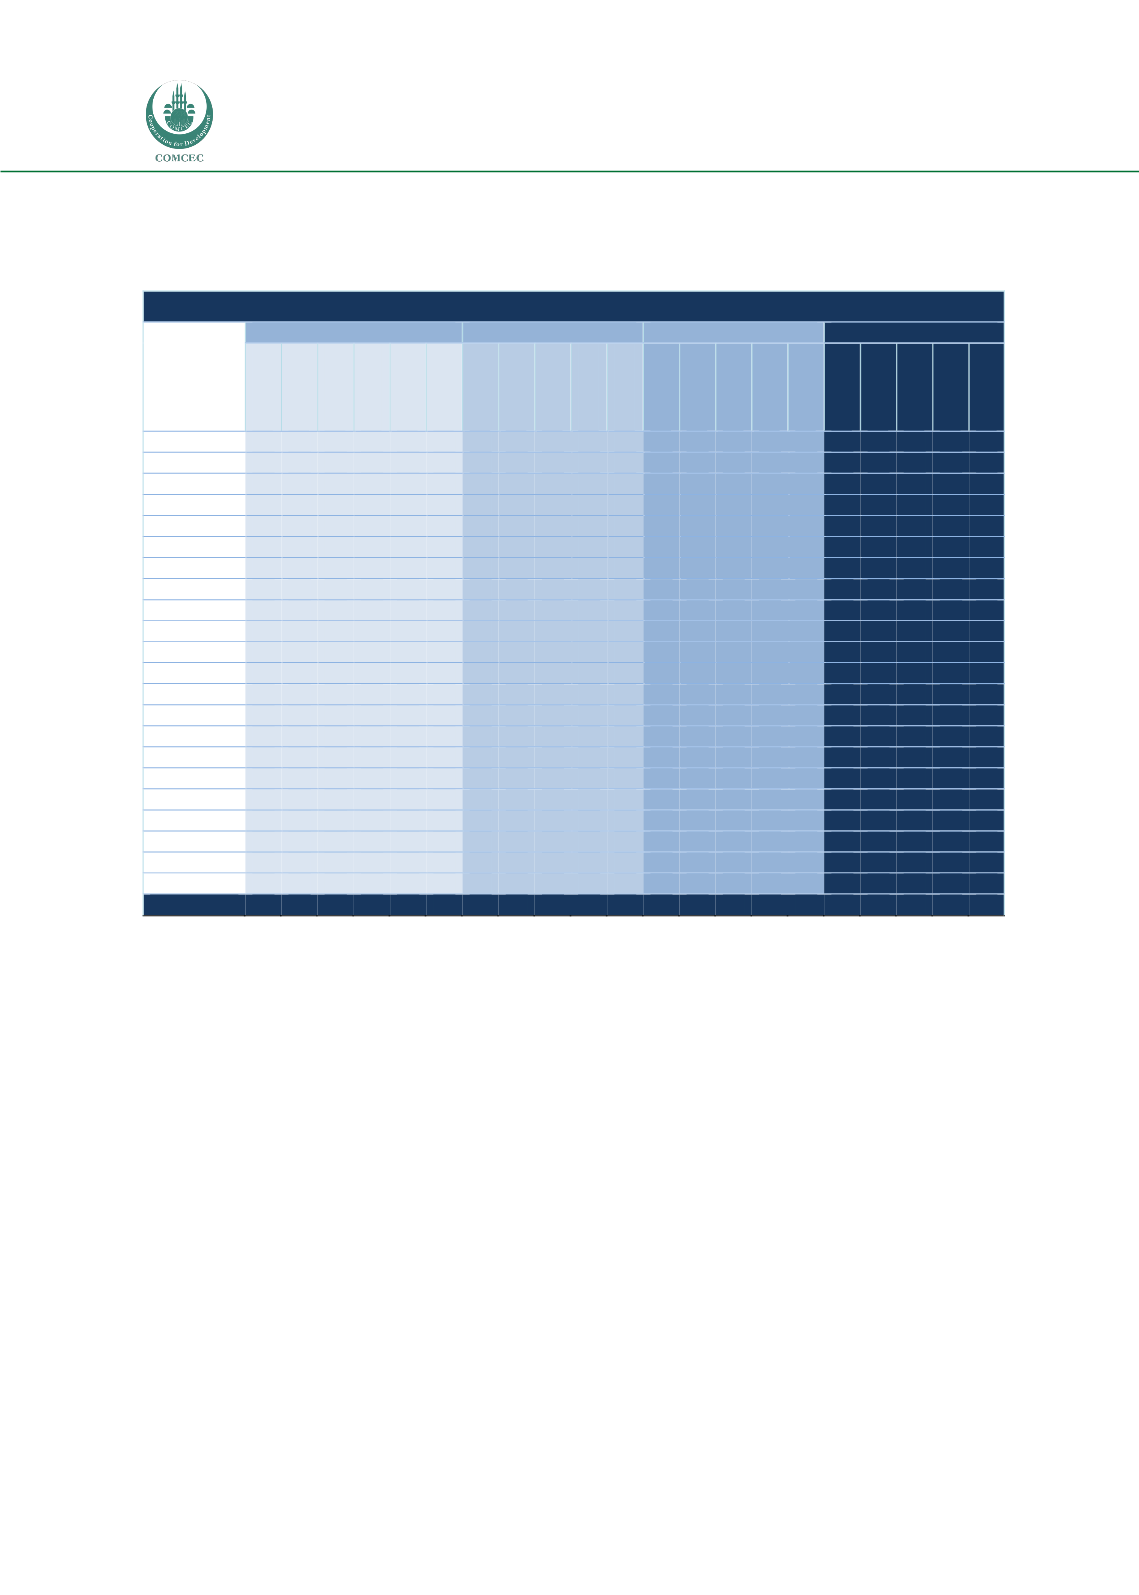
Table 25: Percentage Geographical Coverage of Agricultural Statistics
GEOGRAPHICAL COVERAGE (%)
African Group
Arab Group
Asian Group
COMCEC
National
Regional
Province
District
Village
Others
National
Regional
Province
District
Village
National
Regional
Province
District
Village
National
Regional
Province
District
Village
Production
42 33 17
0
0
8 31 23 38
8
0 27
0 27 45
0
34 20 29 17
0
Area
42 33 17
0
0
8 23 23 31
8 15 27
0 18 55
0
31 20 23 20
6
Yield
45 27 18
0
0
9 25 25 33 17
0 11
0 33 56
0
29 19 29 23
0
Livestock
45 27
9
0
0 18 36
9 45
9
0 27
0 27 45
0
39 13 29 19
0
Forest
63 38
0
0
0
0 38 13 38 13
0 50 10 20 20
0
50 19 19 12
0
Fishery
50 20 20
0
0 10 27 27 36
9
0 60 10 10 20
0
47 20 23 10
0
Prod. pric.
30 30 20
0
0 20 40 30 30
0
0 40 10 40 10
0
39 25 32
4
0
Input pric.
50 25
0
0
0 25 33 33 33
0
0 50 25 25
0
0
44 31 25
0
0
Cons Quan.
33 33 17
0
0 17 78 11 11
0
0 82 18
0
0
0
72 20
8
0
0
Calories
40 40
0
0
0 20 80 20
0
0
0 83 17
0
0
0
73 27
0
0
0
Protein
50 50
0
0
0
0 80 20
0
0
0 80 20
0
0
0
75 25
0
0
0
Fats
50 50
0
0
0
0 80 20
0
0
0 67 33
0
0
0
69 31
0
0
0
Land use
50 38 13
0
0
0 27
9 27 27
9 36 18 18 27
0
37 20 20 20
3
Rural pop
50 30 10
0 10
0 38 13 13 25 13 18
0 18 64
0
34 14 14 31
7
Active pop
50 25
8
0
8
8 50 17 17 17
0 44 22 33
0
0
50 23 19
4
4
Labor
44 33
0
0 11 11 40 20 20 20
0 36 36 27
0
0
41 31 17
7
3
Machinery
63 25
0
0
0 13 44 11 33 11
0 40 20 20 20
0
50 19 19 12
0
Fertilizers
50 25 13
0
0 13 50 10 30 10
0 67 11 11 11
0
58 15 19
8
0
Pesticides
50 25 13
0
0 13 50 10 30 10
0 88
0 13
0
0
64 12 20
4
0
Rural inf
60 40
0
0
0
0 17 17 33 17 17 67
0 33
0
0
43 21 21
7
7
Rural emp
57 43
0
0
0
0 29 29 43
0
0 33 56 11
0
0
39 43 17
0
0
Agric cred.
67 33
0
0
0
0 29 14 43 14
0 40
0 60
0
0
44 17 33
6
0
Average
49 33
8
0
1
9 43 18 27 10
2 49 14 20 17
0 48 22 19
9
1
Source: SSAQ Results.
e.
SNA and EAA
80 percent of COMCEC Members adopted the System of National Accounting (SNA93) and
65 percent said they have the Economic Accounts for Agriculture (EAA) – mostly countries for
2011 and 2012, and a few for 2013
and 2010. 85 percent of African group countries,
78 percent of Asian group countries and 69 percent of Arab group countries adopted the
SNA93. The Arab group, with 85 percent, had the highest percentage of members constructing
EAA, followed by Africa with 62 percent. Only 33 percent of the COMCEC Members in the Asian
group have EAA (Annex 4, Table A4. 9).
f.
Resources
Only a few countries have reportedly budgeted for agricultural statistics. Many have expressed
concerns regarding the accuracy of the numbers reported and/or the reasons for not being
able to report agricultural statistics. On average the yearly agricultural statistics budget
reported by the COMCEC Members is 1.04 million Euros. For the African group this average
budget is 1.7 million Euros. In Africa, Mali is raising the average with 6.4 million Euros while
countries like Benin and Togo reported budgets as low as 122 thousand Euros. In the Asian