


 51 / 206

Improving Agricultural Statistics in the COMCEC Region
39
c.
Sources of Data
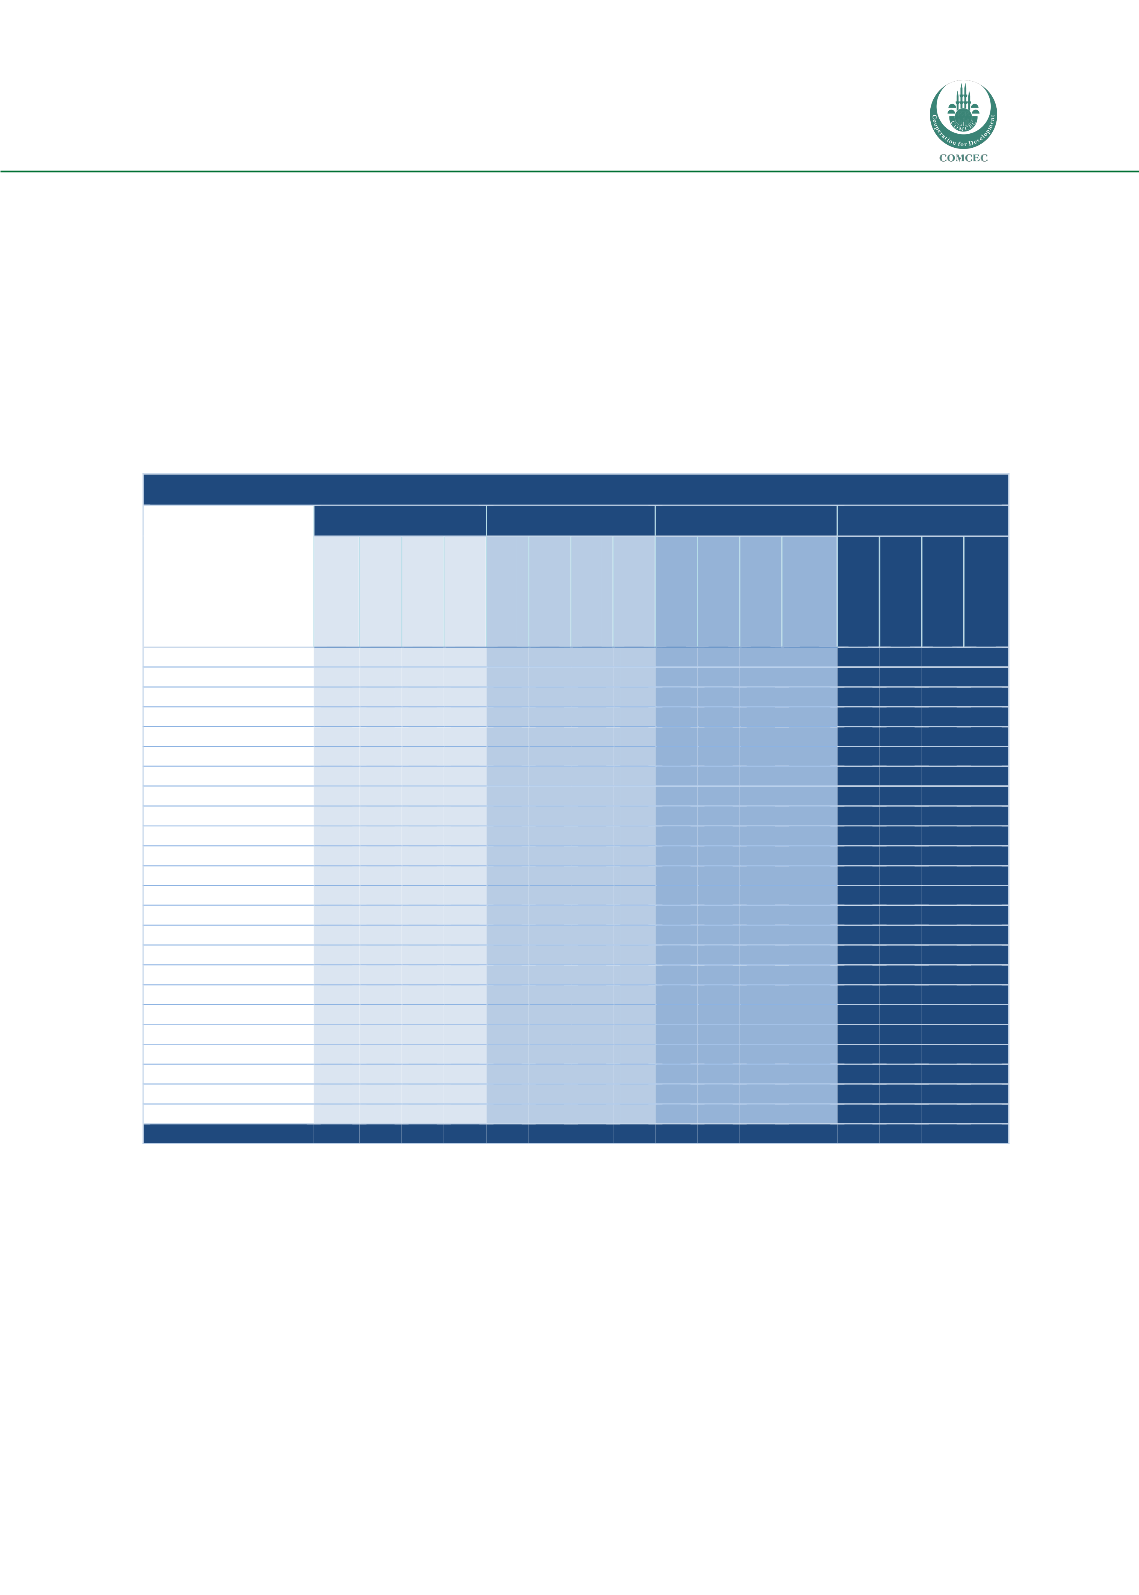
Sources of agricultural statistics are summarized in Table 24. The share of estimated data
ranges between 0-27 percent overall. In the African group percentages of estimated data are
relatively higher than the Arab and Asian groups. It is normal to expect higher levels of
administrative data in trade and estimated data in consumption statistics. However, high
percentages of administrative and estimated data in production are alarming. On average
43 percent of the primary statistics in COMCEC Member Countries are either administrative or
estimated. This ratio is as high as 52 percent in the Asian group, 43 and 37 percent in Arab and
African groups respectively.
Table 24: Percentage Distribution of the Sources of Agricultural Statistics
SOURCE OF DATA (%)
African Group
Arab Group
Asian Group
COMCEC
Survey
Census
Estimation
Admin.
Survey
Census
Estimation
Admin.
Survey
Census
Estimation
Admin.
Survey
Census
Estimation
Admin.
Crop production
71
7
14
7
69
6
6
19
46
8
23
23
63
5
14
16
Harvested area
71
7
14
7
56
19
6
19
43
7
21
29
59
8
13
15
Yield per hectare
69
0
23
8
64
7
0
29
50
8
17
25
67
3
12
15
Livestock prod.
50
17
25
8
54
8
0
38
38
15
8
38
50
10
12
24
Forest products
50
0
13
38
20
10
10
60
42
8
8
42
42
2
13
42
Fishery products
55
0
27
18
36
7
7
50
54
8
8
31
52
4
15
27
Agric. export
13
0
0
88
8
0
0
92
11
0
0
89
8
13
0
88
Agric. import
14
0
0
86
7
0
0
93
11
0
0
89
8
13
0
88
Producer prices
90
0
0
10
58
0
0
42
75
0
0
25
74
0
0
26
Input prices
100
0
0
0
45
0
0
55
67
0
0
33
56
0
0
44
Cons. Quantity
83
0
17
0
67
0
0
33
40
0
10
50
60
0
10
30
Calories
80
0
20
0
60
0
20
20
60
0
20
20
64
0
21
14
Protein
50
0
50
0
60
0
20
20
50
0
25
25
55
0
27
18
Fats
50
0
50
0
60
0
20
20
60
0
20
20
55
0
27
18
Land use
50
10
0
40
42
17
17
25
17
8
8
67
41
5
7
44
Rural population
17
42
33
8
33
33
22
11
17
58
0
25
23
58
23
13
Active population
18
55
27
0
56
33
0
11
60
30
0
10
43
28
7
7
Labor
56
22
11
11
82
9
0
9
73
9
9
9
73
4
8
8
Machinery
43
14
0
43
60
10
0
30
9
27
0
64
43
7
0
43
Fertilizers
63
13
0
25
45
0
0
55
10
10
0
80
43
5
0
50
Pesticides
75
13
0
13
45
0
0
55
0
0
0
100
46
2
0
50
Rural infrastruct.
20
20
0
60
29
14
0
57
0
0
0
100
21
9
0
64
Rural employm.
56
11
11
22
78
11
0
11
78
11
0
11
70
4
0
15
Agricult. credit
33
17
0
50
50
0
0
50
0
20
0
80
29
3
0
65
Average
53
10
14
23
49
8
5
38
38
9
7
45
48
8
9
34
Source: SSAQ Results.
d.
Geographical Coverage
Table 25 presents the distribution of statistical data by geographic coverage. Overall, nearly
half the agricultural statistics are at the national level, 22 percent at the regional level and
30 percent at the provincial and lower levels. In the African and Asian groups, the percentage
of statistics reported at the national level is the same, at 49 percent. The Arab group has the
lowest percentage (43 percent) of statistics reported at the national level. Almost all
consumption statistics are reported at the national or regional levels. The highest level of