
Increasing Agricultural Productivity:
Encouraging Foreign Direct Investments in the COMCEC Region
62
4.
Case Studies
By examining different cases of FDI in the agricultural sector it is possible to identify in real and
practical terms the motives and objectives of foreign investors, the criteria they employ in
evaluating potential investments and investment locations. They illustrate the importance of
different elements of target countries’ investment environments and value propositions,
including operating costs, taxation, regulatory framework, investment security, domestic
markets, access to international markets and potential for integration into global supply chains,
and investment incentives. Three different cases are presented, starting with Saudi Arabia and
Qatar, two GCC States actively seeking for outward FDI projects to ensure food security. This
case is followed by the case of Turkey, one of the most promising inward agricultural FDI
destination at the moment. Finally, a third case will look at the challenges of Ethiopia as a non-
COMCEC Member and illustrates the tension between ambitious FDI plans in relation to
sustainability.
4.1
Case I Saudi Arabia, and Qatar as Sources for Outward FDI
The GCC countries, of which Saudi Arabia is by far the largest, in both population and land area,
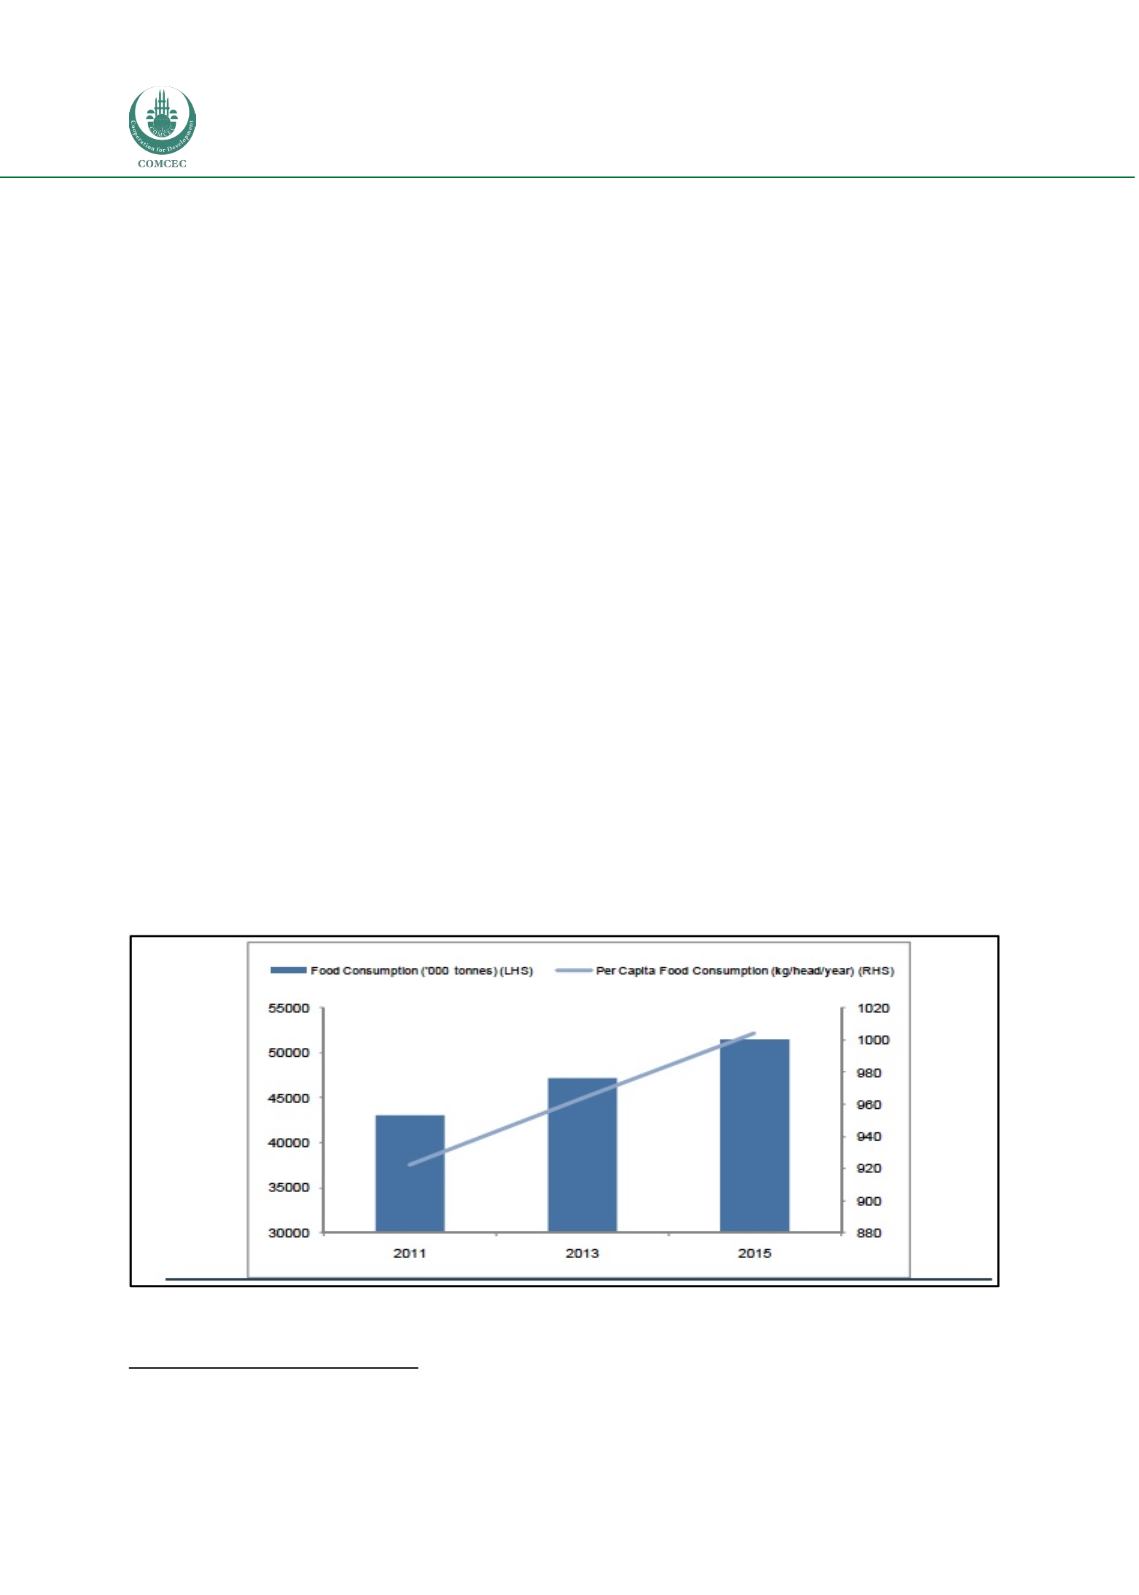
have a combined population of about 40 million, which is growing at more than three percent
annually (see Figure 27). Rising population and substantial disposable income for most
segments of the population point to rapid growth in food consumption, most of which is likely to
be met by imports. Rising incomes are also contributing to a change in consumption patterns,
including both a shift to a higher protein diet that includes more meat and dairy products, and
increasing demand for health foods, itself a response to higher prevalence of obesity and related
ailments such as diabetes. In a quest to ensure food security, many GCC countries are investing
heavily in agricultural production outside the region, in both developing and developed
countries.
Figure 27: GCC Food Consumption, Total and Per Capita
Source
:
FAO graph produced by Alpen Capital
83
83
Alpen Capital (2011),
GCC Food Industry,
June 28, 2011, p. 9.


