
Increasing Agricultural Productivity:
Encouraging Foreign Direct Investments in the COMCEC Region
26
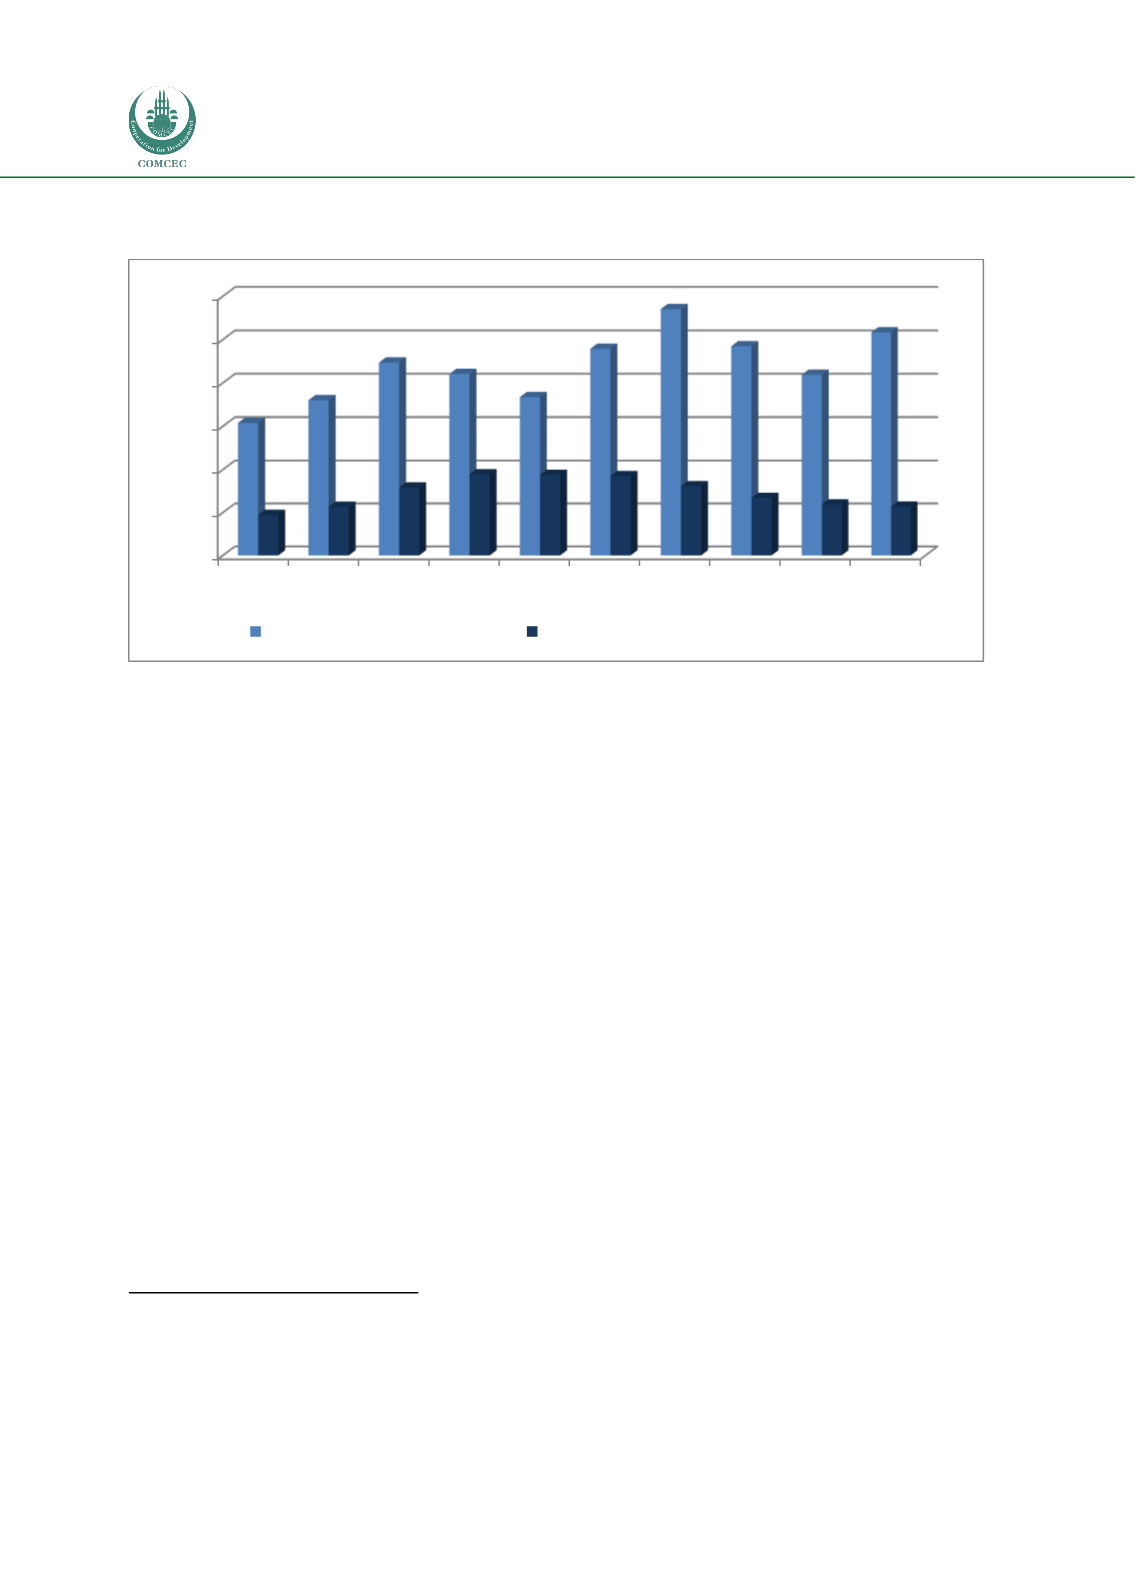
Figure 9: Total Inward FDI Flows COMCEC Member Countries as percentage of World Total
and as percentage of GDP.
Source: UNCTAD, 2013.
2.4.1
Foreign direct investment trends in the agricultural sector
The total value of agricultural FDI has grown steadily in recent years, though it appears to be a
rather recent phenomenon
40
. The late 2000s witnessed a surge in agricultural-related FDI,
which is most likely connected with the sharp rise in commodity and energy prices on the one
hand and long-term expectations such as population growth and increasing market demand for
bio fuels, food and raw materials on the other hand
41
.
With 70 percent of the COMCEC’s LDMC’s population living in rural areas, and agriculture
contributing approximately 23 percent to their GDP, it is clear that in the developing world, at
the core of any sustainable development and poverty reduction strategy is the development of
agriculture. Gallup shows that an additional one percent increase in per capita agricultural
output would result a 1.6 percent increase in the incomes of the poorest 20 percent of the
population
42
. These findings are further supported after a cross-country analysis found that a 1
percent increase in agriculture yields would reduce the number of people living on less than $1 a
day by 0.83 percent
43
. In addition, the growth multiplier effects between agriculture and the rest
of the economy are relatively strong with every $1 of additional farm income creating a further
$0.8 non-farm income in Asia. The multipliers are even stronger in the case of Africa where it
ranges from $0.96 in Niger to $1.68 in Burkina Faso.
44
Agricultural FDI can be executed in various forms. Foreign investments in land, agribusiness and
water entitlements are the most predominant forms of agricultural FDI. In particular,
40
FAO, 2012a; Gunasekera et al, 2012; UNCTAD, 2012.
41
Ibid
42
Gallup, J., Radelet S. and Warner A. , 1997.
43
Thirtle, C., X. Irz, V. McKenzie-Hill and S. Wiggins, 2001.
44
Delgado, C., Hopkins J. and Kelly V., 1998.
0,0
2,0
4,0
6,0
8,0
10,0
12,0
2003 2004 2005 2006 2007 2008 2009 2010 2011 2012
Percentage of total world
Percentage of Gross Domestic Product


